Massachusetts mammals

Black Rat in Massachusetts

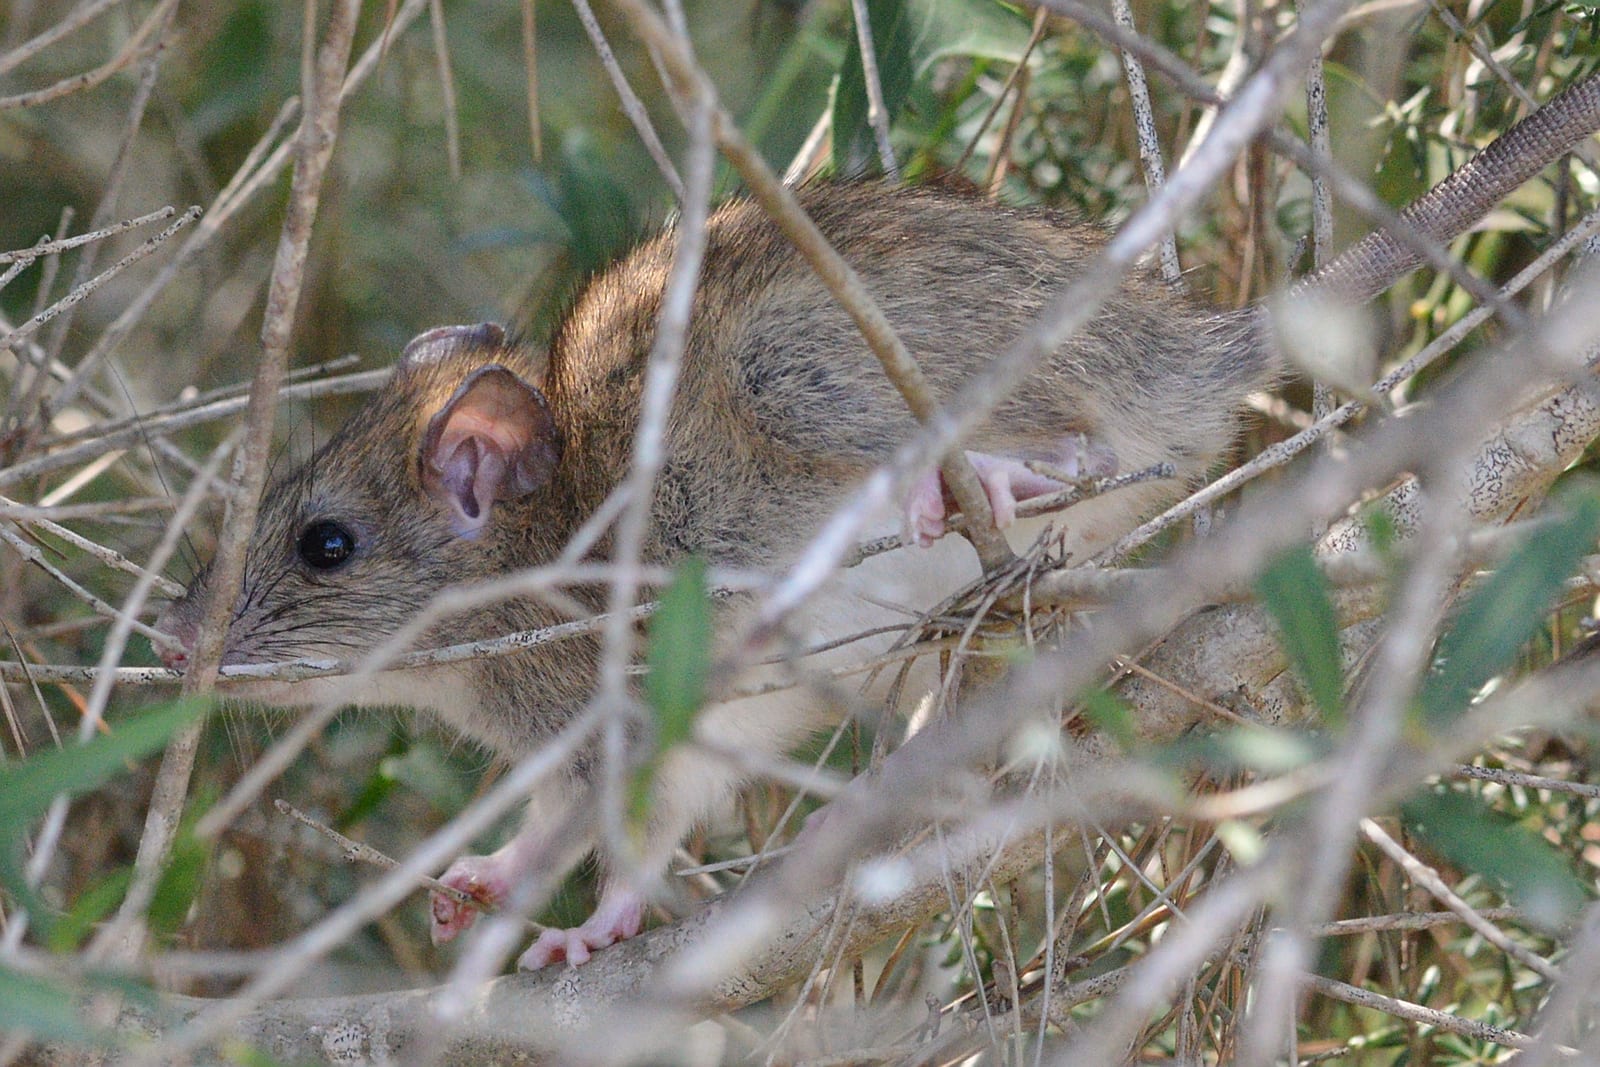
Rattus rattus

Introduced to Massachusetts

Massachusetts's Rattus rattus records are of an introduced species; it does not occur here as a wild native population.

IUCN Red List status

  1. LC
  2. NT
  3. VU
  4. EN
  5. CR
  6. EW
  7. EX

LC – Least Concern

Widespread and abundant; not at risk.

Black Rat in Massachusetts, by the numbers

Occasional in Massachusetts 47th most recorded of 93 mammals logged in Massachusetts

50 occurrence records

Records from 2000–2026.

50 total records count every Massachusetts occurrence from GBIF and iNaturalist; the monthly chart covers the 40 records with a full observation date.

When to look for the Black Rat in Massachusetts

Most sightings fall in February.

40 Massachusetts occurrence records (iNaturalist and GBIF) by month of year, 2000–2026. Shows when the species is recorded, not a guarantee of presence.

Monthly Massachusetts records (table)
MonthRecords
January0
February13
March4
April3
May3
June0
July1
August0
September4
October2
November5
December5

Monthly black rat occurrence records (iNaturalist and GBIF) in Massachusetts, 2000–2026.

Seasonality

Year-round in Massachusetts, with recorded sightings peaking in February.

Occurrence map

Where Black Rat has been recorded in Massachusetts

50 records mapped · zoom and drag to explore

50 Massachusetts records mapped

Where it's recorded in Massachusetts

CountyRecords
Worcester County 16
Hampshire County 14
Middlesex County 12
Suffolk County 7
Hampden County 1

The complete county distribution, spread across 5 Massachusetts counties. Every occurrence record falls in one county, so these sum to the total. Counties from GBIF and US Census boundaries.

The black rat isn’t a Massachusetts native, and the state’s record reads like the biography of an import. This is the old ship rat of the seafaring centuries, an introduced species that arrived with people and persists around buildings, warehouses, and port infrastructure. NatureServe gives it no state rank, since conservation categories don’t apply to a species that was never part of the local fauna.

The county pattern is more inland than a seafaring reputation would suggest: Worcester, Hampshire, and Middlesex lead the reports, with Suffolk, the Boston waterfront, behind them. Port cities were the entry points, but an animal that lives where people store food and grain follows rail lines and highways inland just as well. The records track human settlement more than any wild habitat.

Reports cluster oddly in February, with smaller numbers scattered through the rest of the year. Midwinter is when rats move into heated buildings and when pest-control calls and indoor sightings spike, so the calendar reflects when people notice them, not when they’re most active. Coastal refuges like those on Cape Cod and the North Shore hold similar cover, but the reports themselves come from towns and cities. This rat goes where people go.
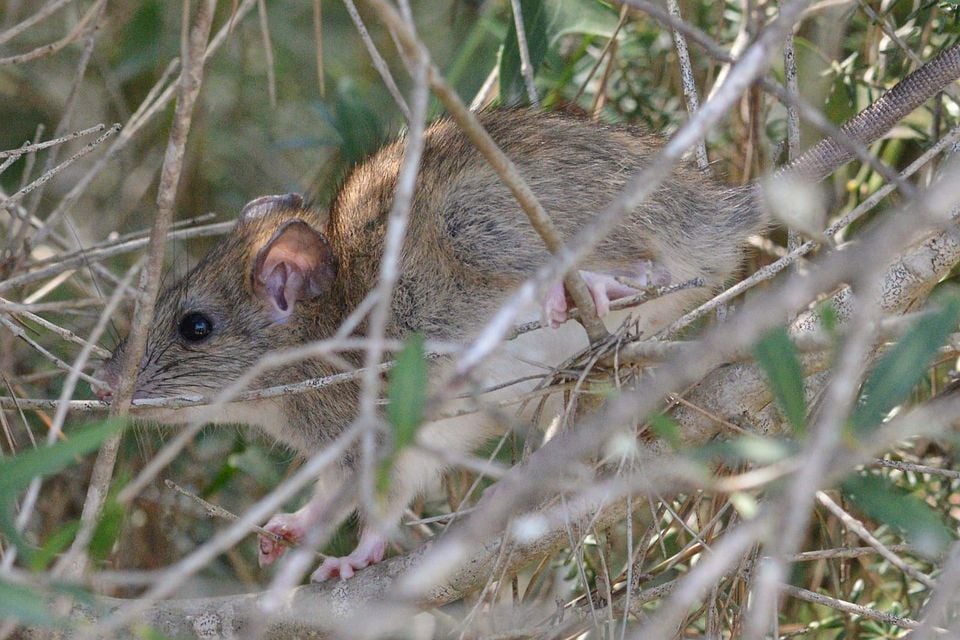

Occurrence data from GBIF.

More mammals in Massachusetts in the atlas

Data & sources

The data and visualizations on this page draw on these open sources:

  • GBIFCC-BY 4.0occurrence records behind the range map, elevation, and record counts
  • iNaturalistCC0 / CC-BY / CC-BY-SAobservations, photos, and audio recordings
  • NatureServe ExplorerCC-BYthe state conservation rank
  • IUCN Red Listattributed factthe global conservation status
  • USGS NASpublic domainnative / introduced status
  • Natural Earthpublic domainthe relief basemap
  • USFSpublic domainnational-forest boundaries