Michigan mammals

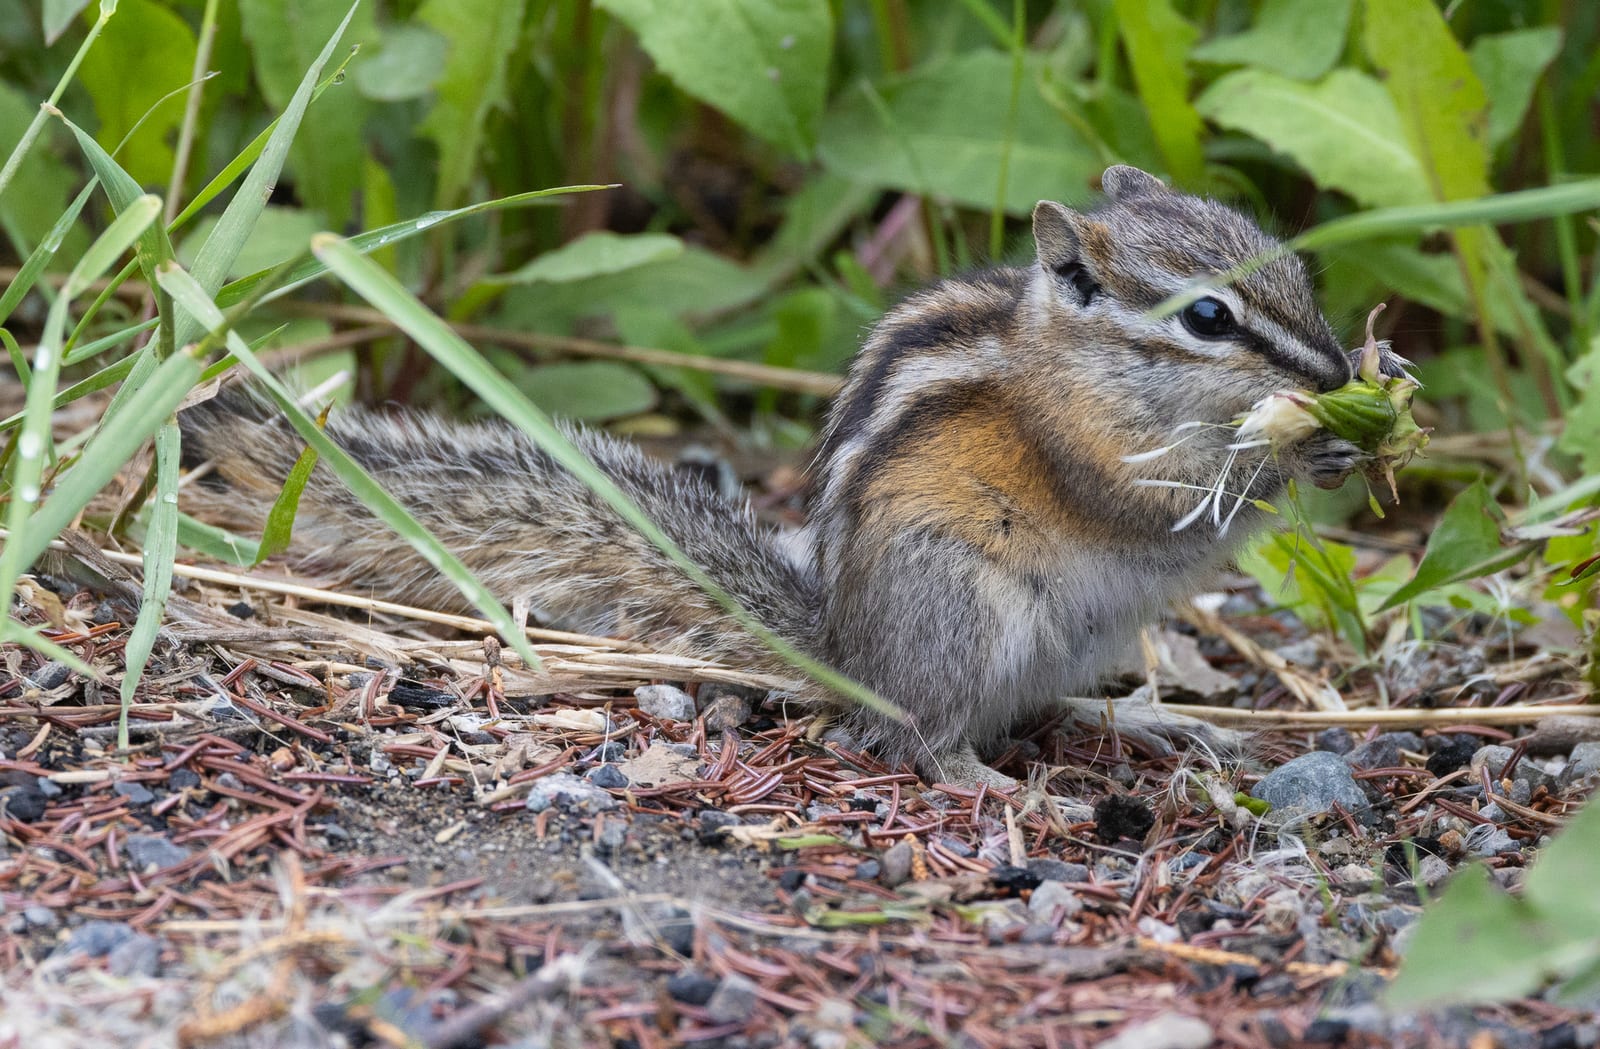
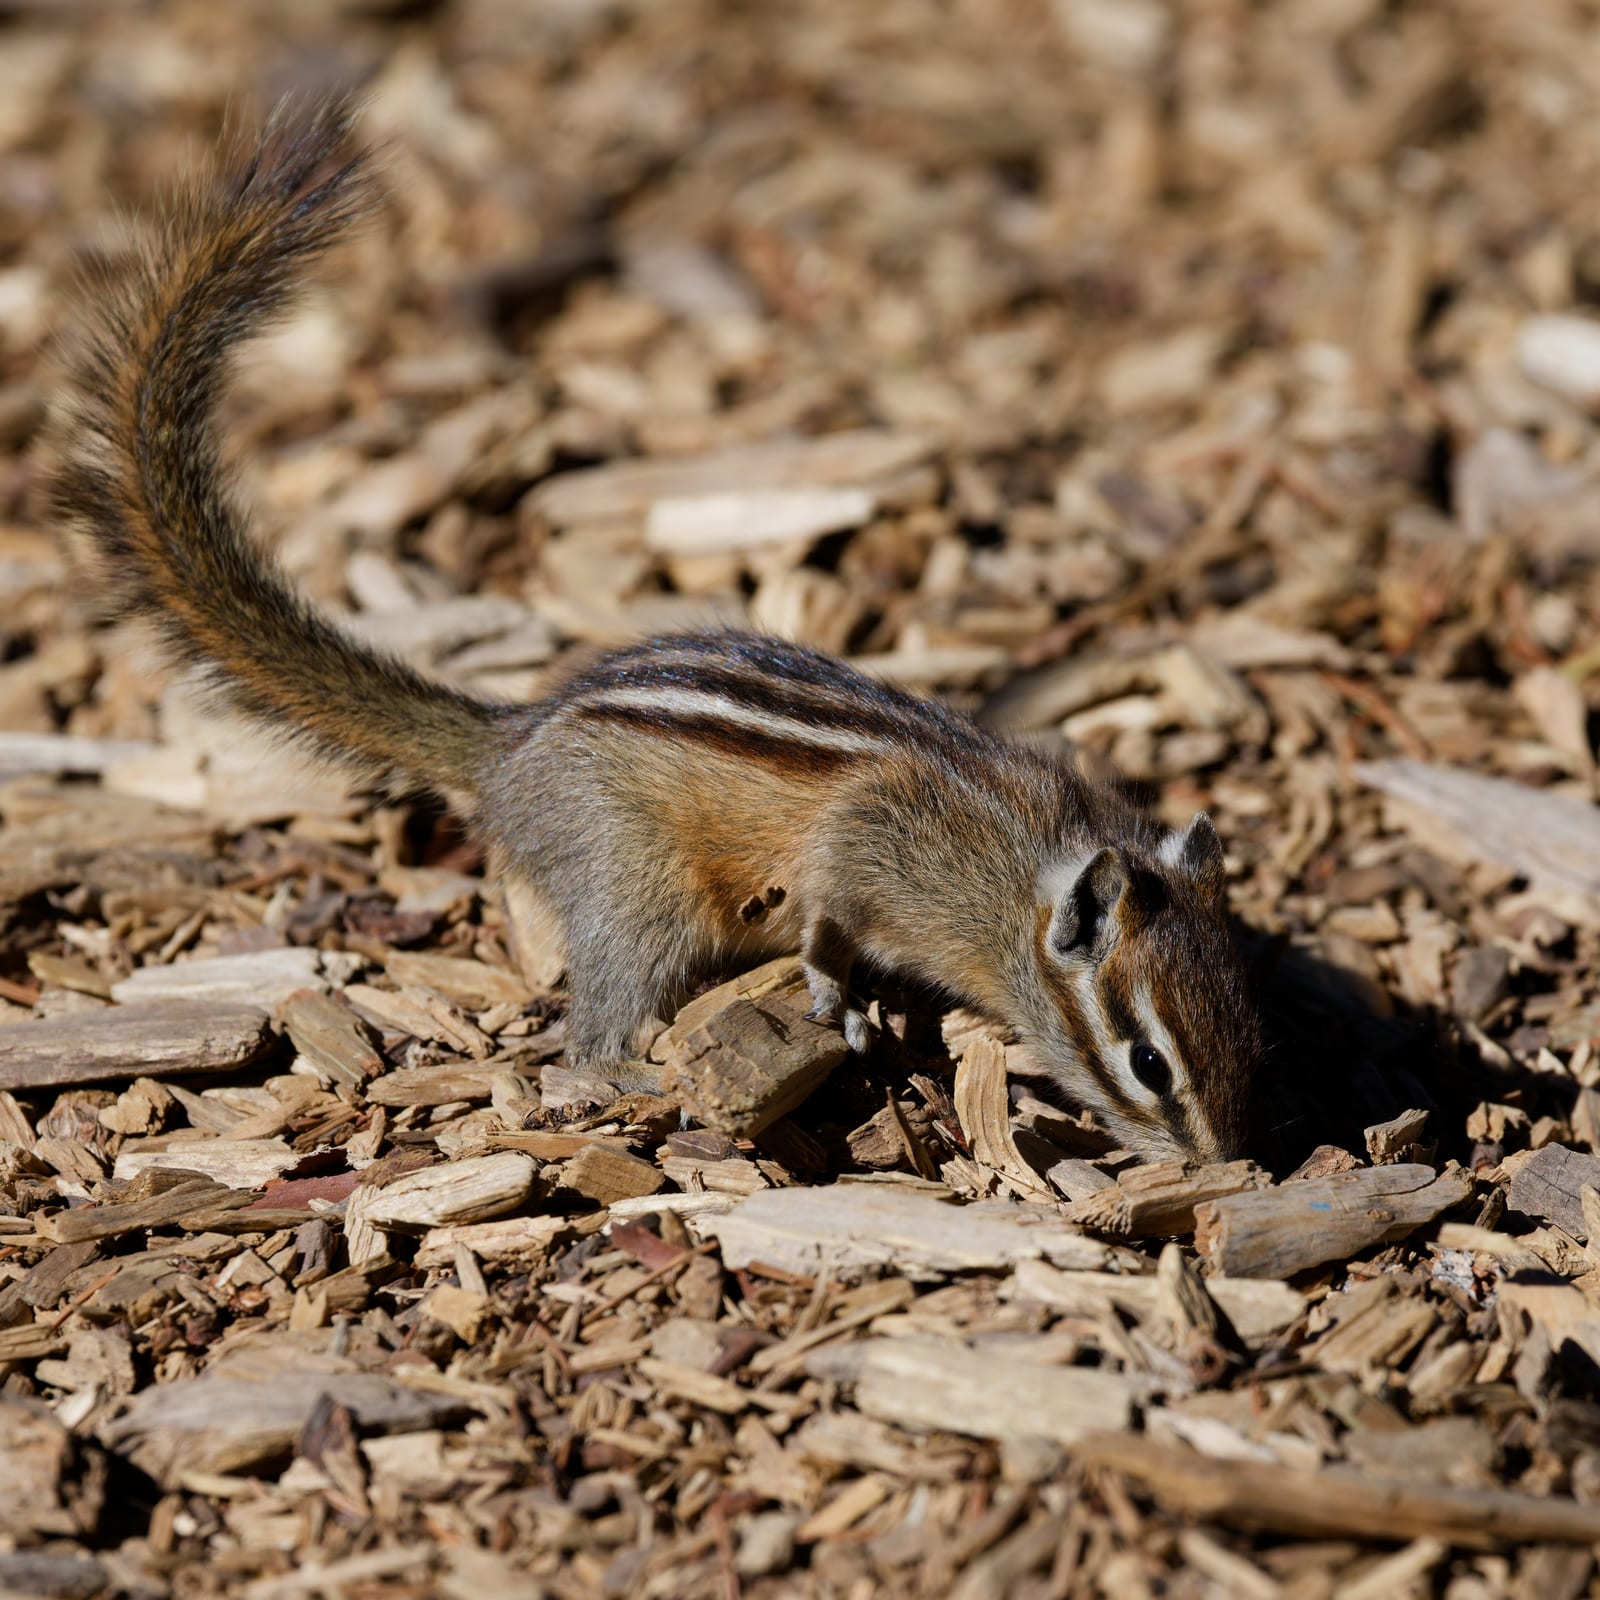
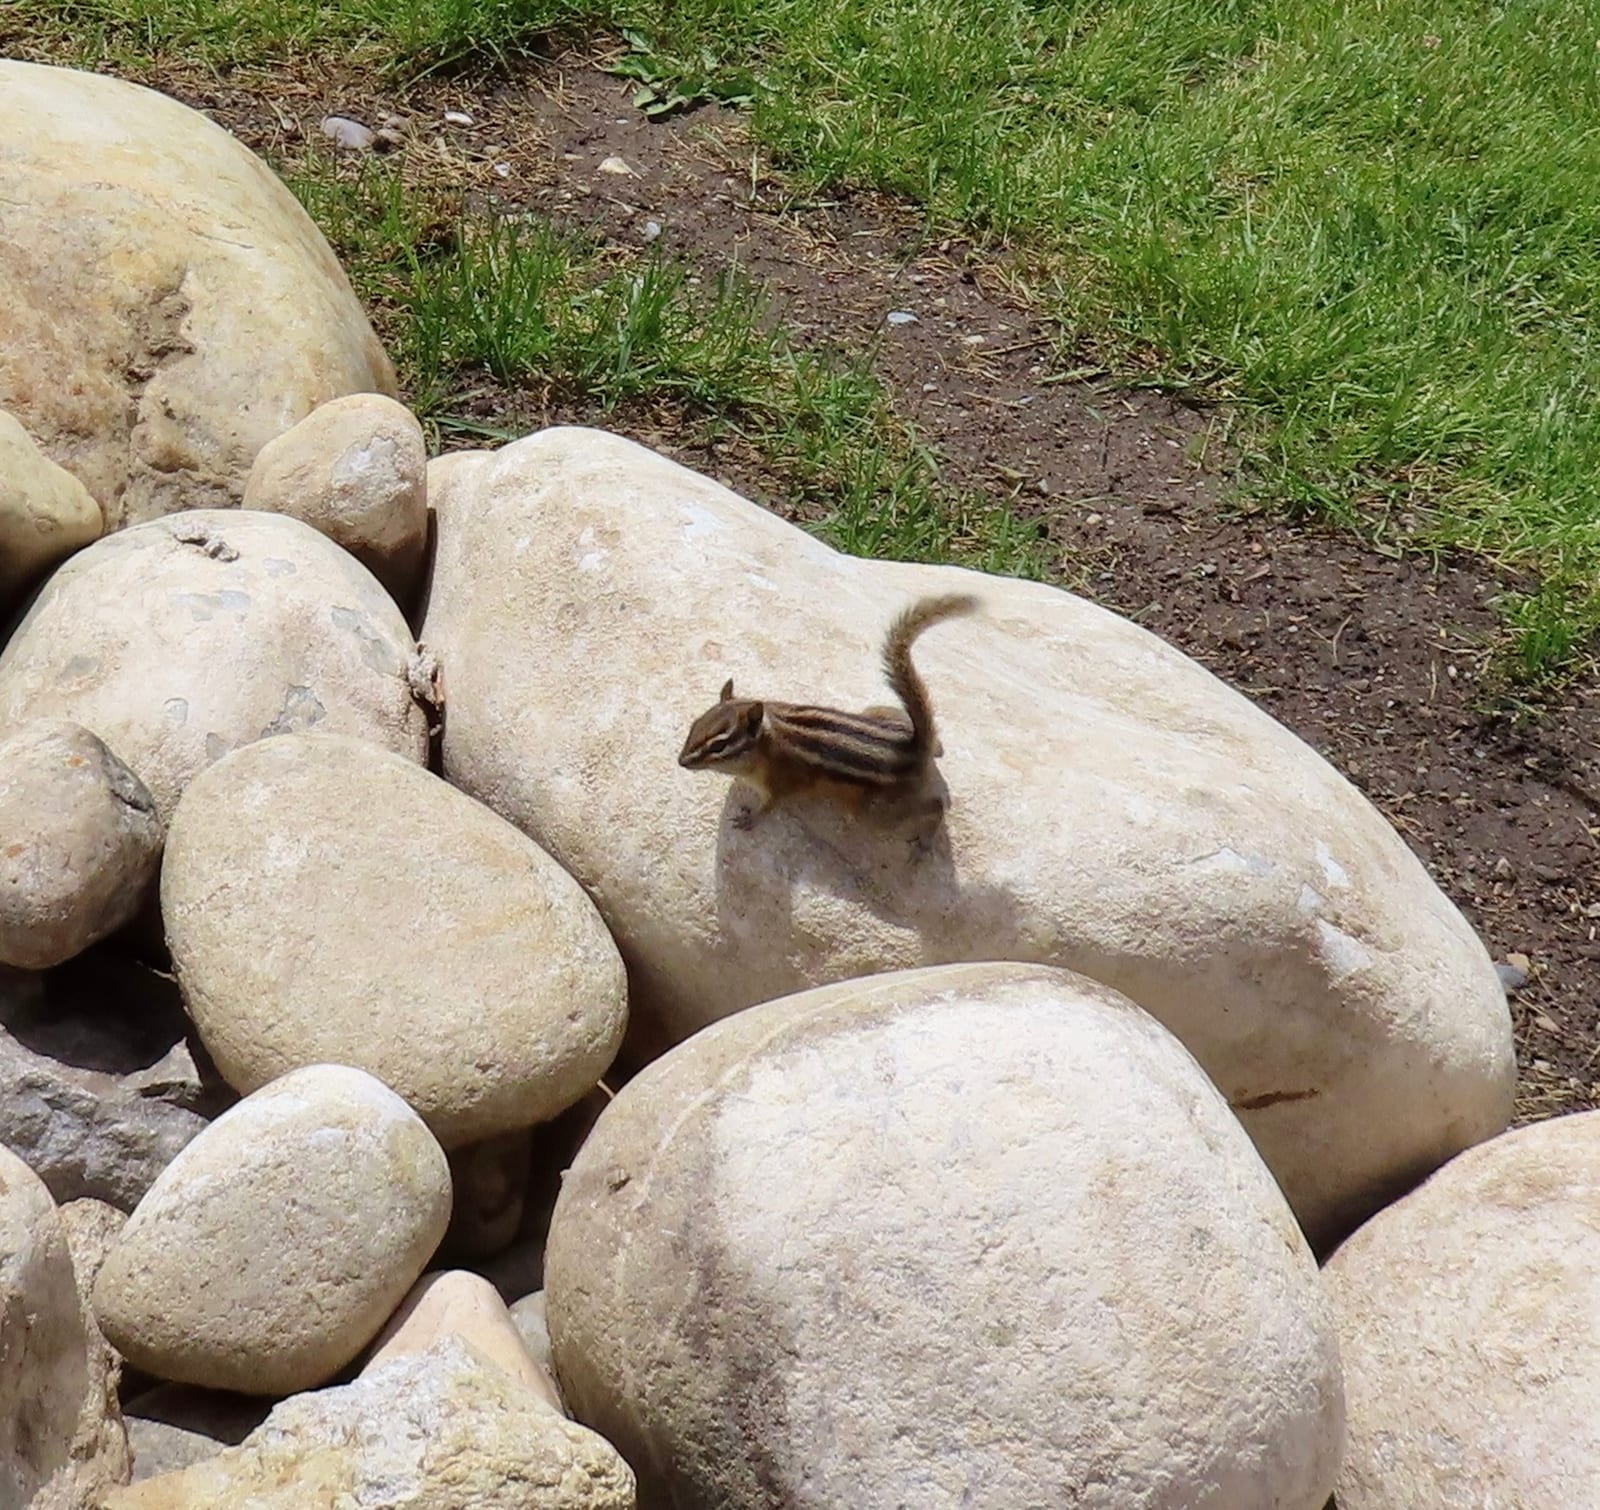
Least Chipmunk in Michigan

Neotamias minimus

Native to Michigan S3 Vulnerable in Michigan

Not listed as nonindigenous in Michigan by USGS NAS; native to its Michigan range.

IUCN Red List status

  1. LC
  2. NT
  3. VU
  4. EN
  5. CR
  6. EW
  7. EX

LC – Least Concern

Widespread and abundant; not at risk.

Least Chipmunk in Michigan, by the numbers

Occasional in Michigan 37th most recorded of 75 mammals logged in Michigan

143 occurrence records
124 with iNaturalist photos

Records from 2000–2026.

143 total records count every Michigan occurrence from GBIF and iNaturalist; the map plots a georeferenced sample of 136; the monthly chart covers the 136 records with a full observation date.

When to look for the Least Chipmunk in Michigan

Most sightings fall in June to September.

136 Michigan occurrence records (iNaturalist and GBIF) by month of year, 2000–2026. Shows when the species is recorded, not a guarantee of presence.

Monthly Michigan records (table)
MonthRecords
January0
February0
March1
April13
May14
June23
July25
August28
September21
October10
November1
December0

Monthly least chipmunk occurrence records (iNaturalist and GBIF) in Michigan, 2000–2026.

Seasonality

Year-round in Michigan, with recorded sightings peaking in June–September.

Occurrence map

Where Least Chipmunk has been recorded in Michigan

136 records mapped · zoom and drag to explore

136 Michigan records mapped

Notable places to look

Park, forest, or monumentiNaturalist records
Ottawa National Forest 25
Pictured Rocks National Lakeshore 7
Newberry State Forest Area 6
Baraga Plains State Wildlife Management Area 4
Crystal Falls State Forest Area 2
Beaver Basin Wilderness Area 2
Bullock Ranch State Wildlife Management Area 1
Cusino State Wildlife Research Area 1

Protected places with the most least chipmunk sightings, from the USGS Protected Areas Database plus named mountain ranges, good spots to look, not a full breakdown, so they don't sum to the total.

Where it's recorded in Michigan

CountyRecords
Gogebic County 28
Marquette County 20
Schoolcraft County 17
Chippewa County 12
Alger County 11
Baraga County 8
Keweenaw County 7
Iron County 7
Houghton County 5
Delta County 1
Ontonagon County 1
Mackinac County 1
Other localities 25

The complete county distribution, spread across 12 Michigan counties. Every occurrence record falls in one county, so these sum to the total. Counties from GBIF and US Census boundaries.

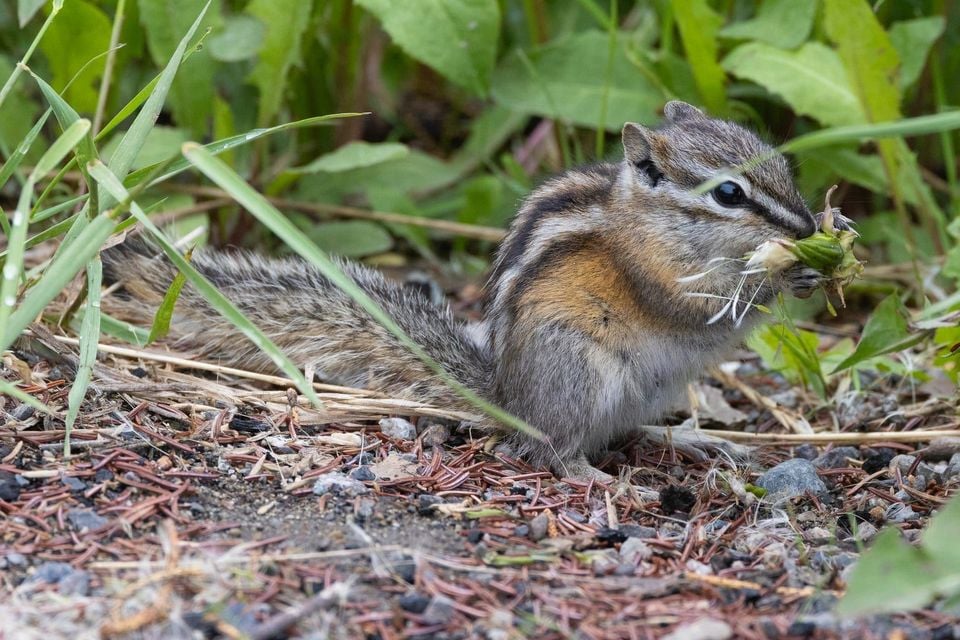
Least chipmunk reports in Michigan concentrate around Seney, Shiawassee, and Detroit River national wildlife refuges, three sites that bracket the species’ patchy hold on the state from the northern Upper Peninsula down toward the southern border. Michigan sits at the eastern edge of a range that otherwise spans boreal Canada and the northern Rockies.

That edge-of-range position shows up in the numbers: NatureServe ranks the least chipmunk S3, Vulnerable, in Michigan even though it’s G5, Secure, across its full range. Reports run from May through September and peak in August, a pattern that traces observer activity more than the animal’s true seasonal rhythm.

Occurrence data from iNaturalist and GBIF.

More mammals in Michigan in the atlas

Data & sources

The data and visualizations on this page draw on these open sources:

  • GBIFCC-BY 4.0occurrence records behind the range map, elevation, and record counts
  • iNaturalistCC0 / CC-BY / CC-BY-SAobservations, photos, and audio recordings
  • NatureServe ExplorerCC-BYthe state conservation rank
  • IUCN Red Listattributed factthe global conservation status
  • USGS NASpublic domainnative / introduced status
  • Natural Earthpublic domainthe relief basemap
  • USFSpublic domainnational-forest boundaries
  • USGS Protected Areas Databasepublic domainthe named parks, forests, and refuges behind "notable places to look"