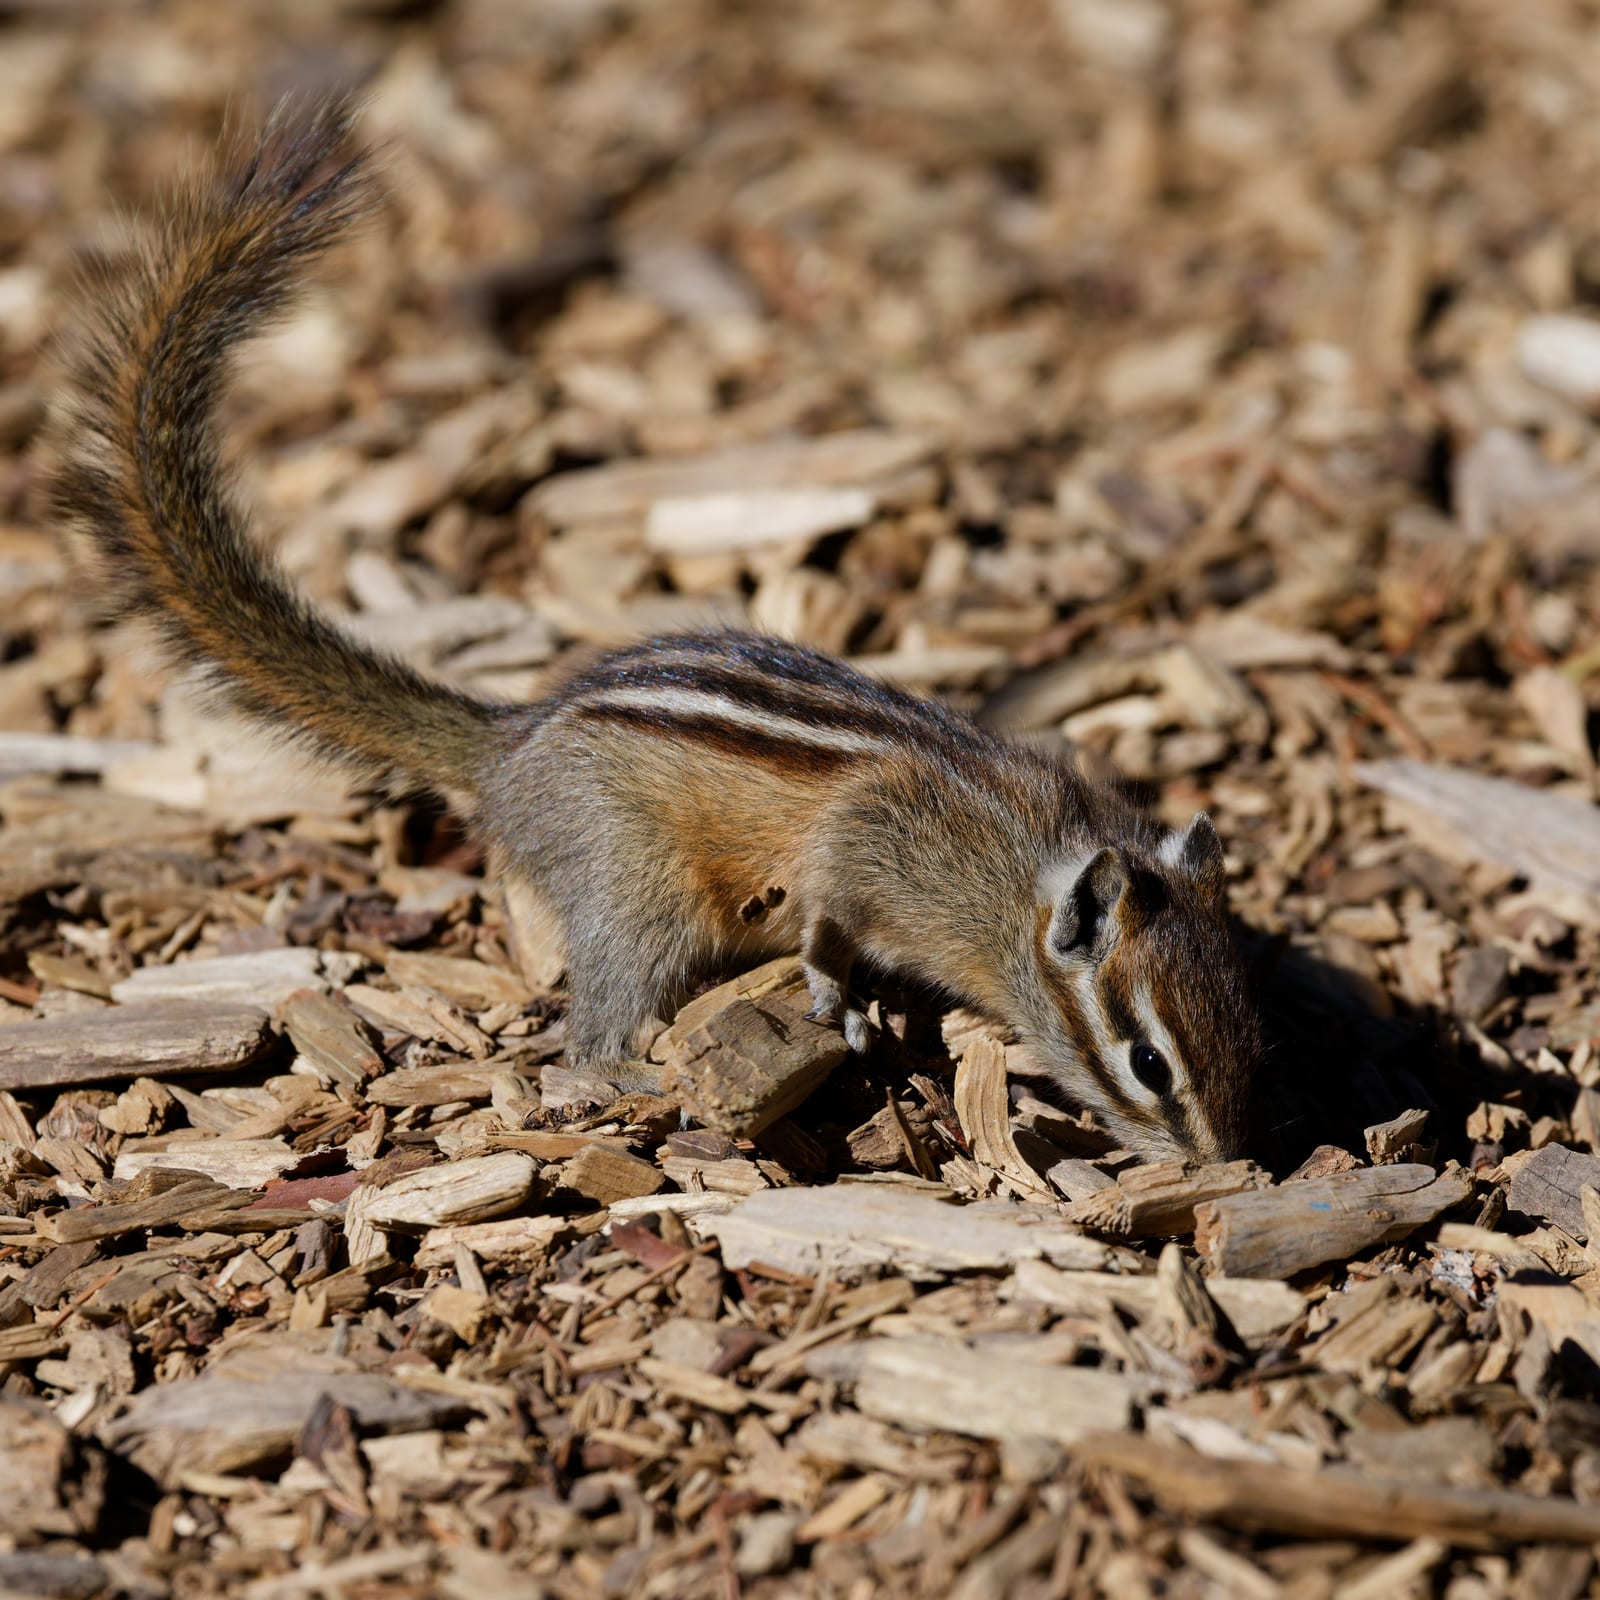
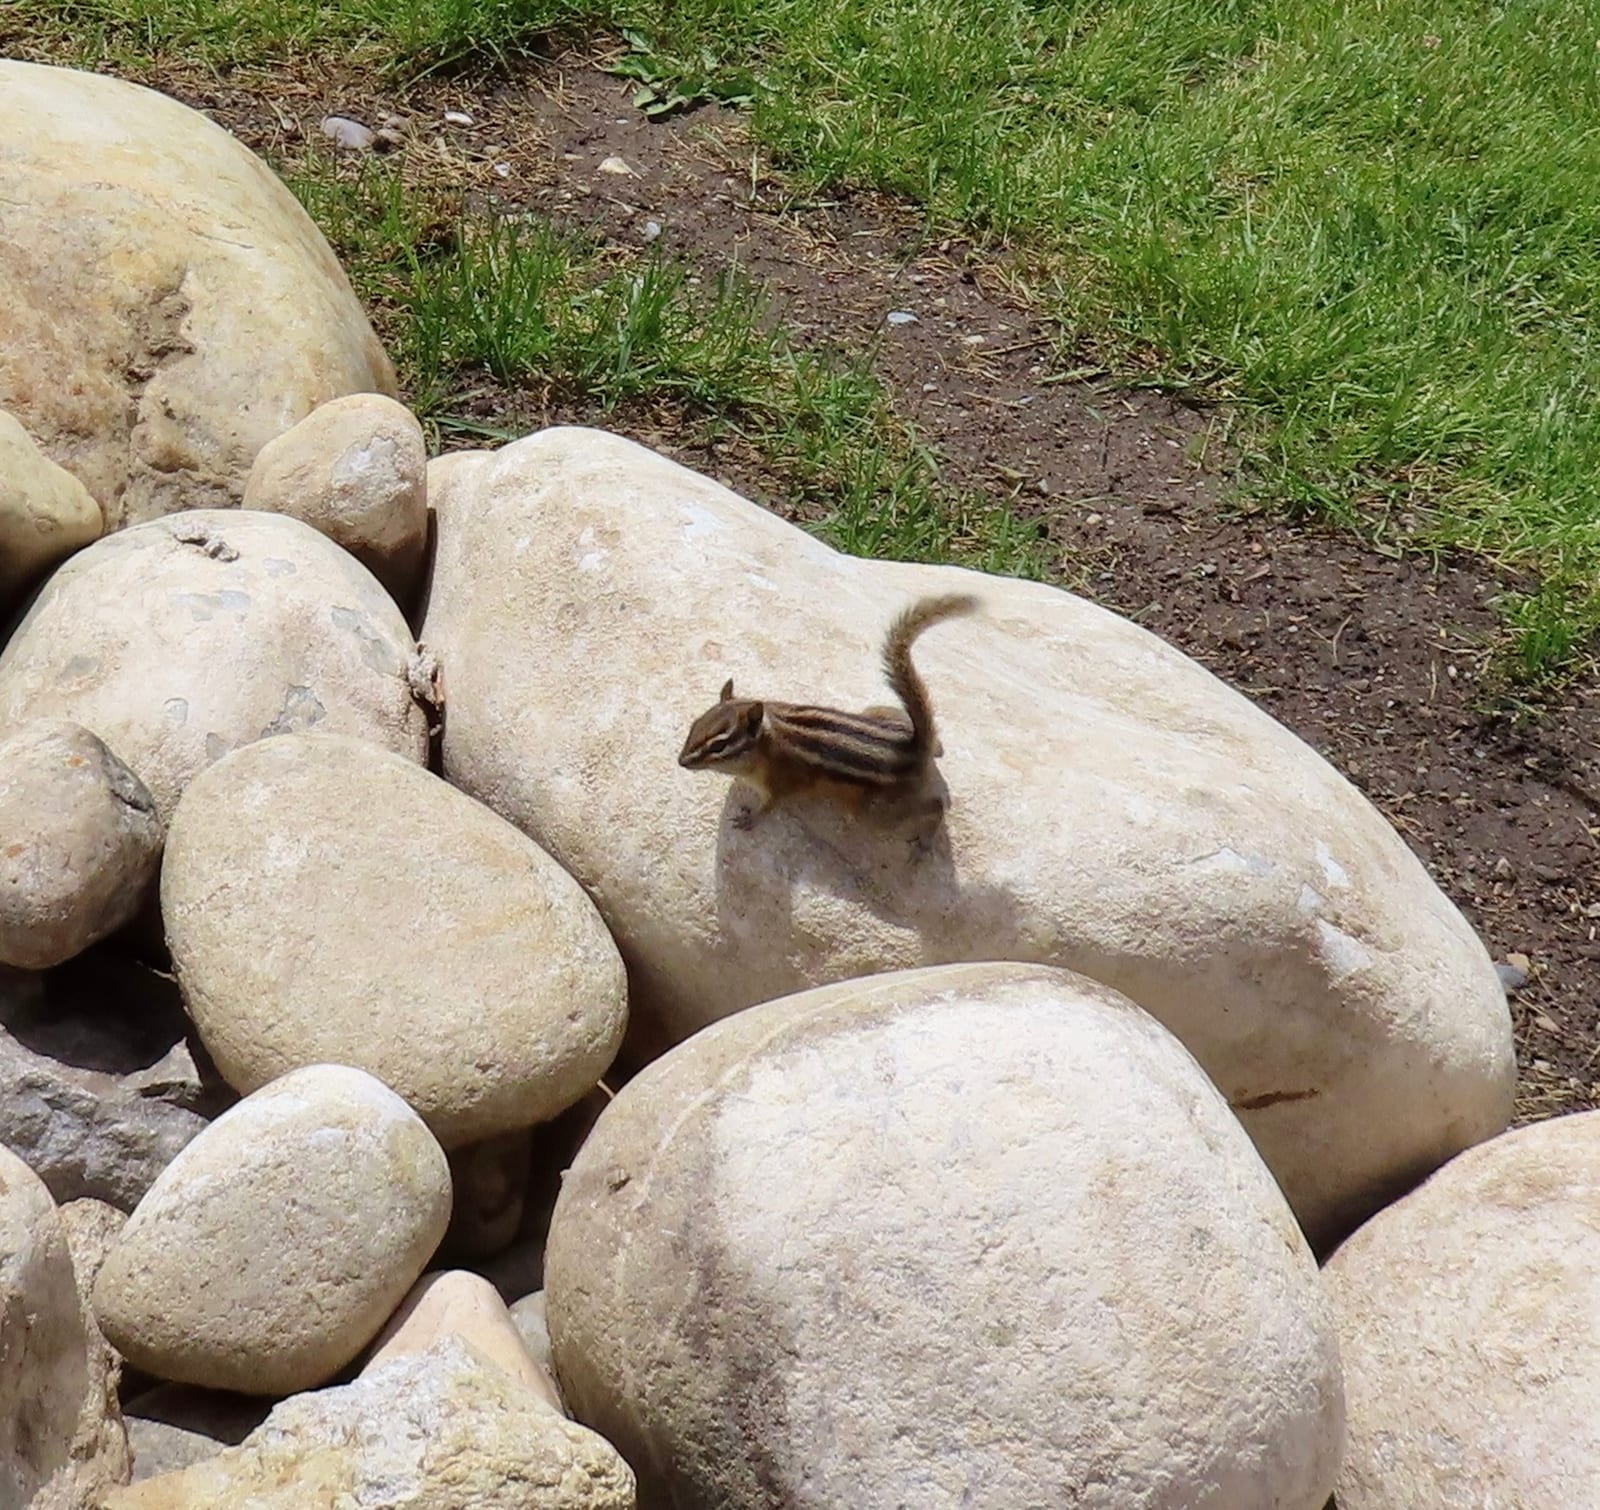
Utah mammals

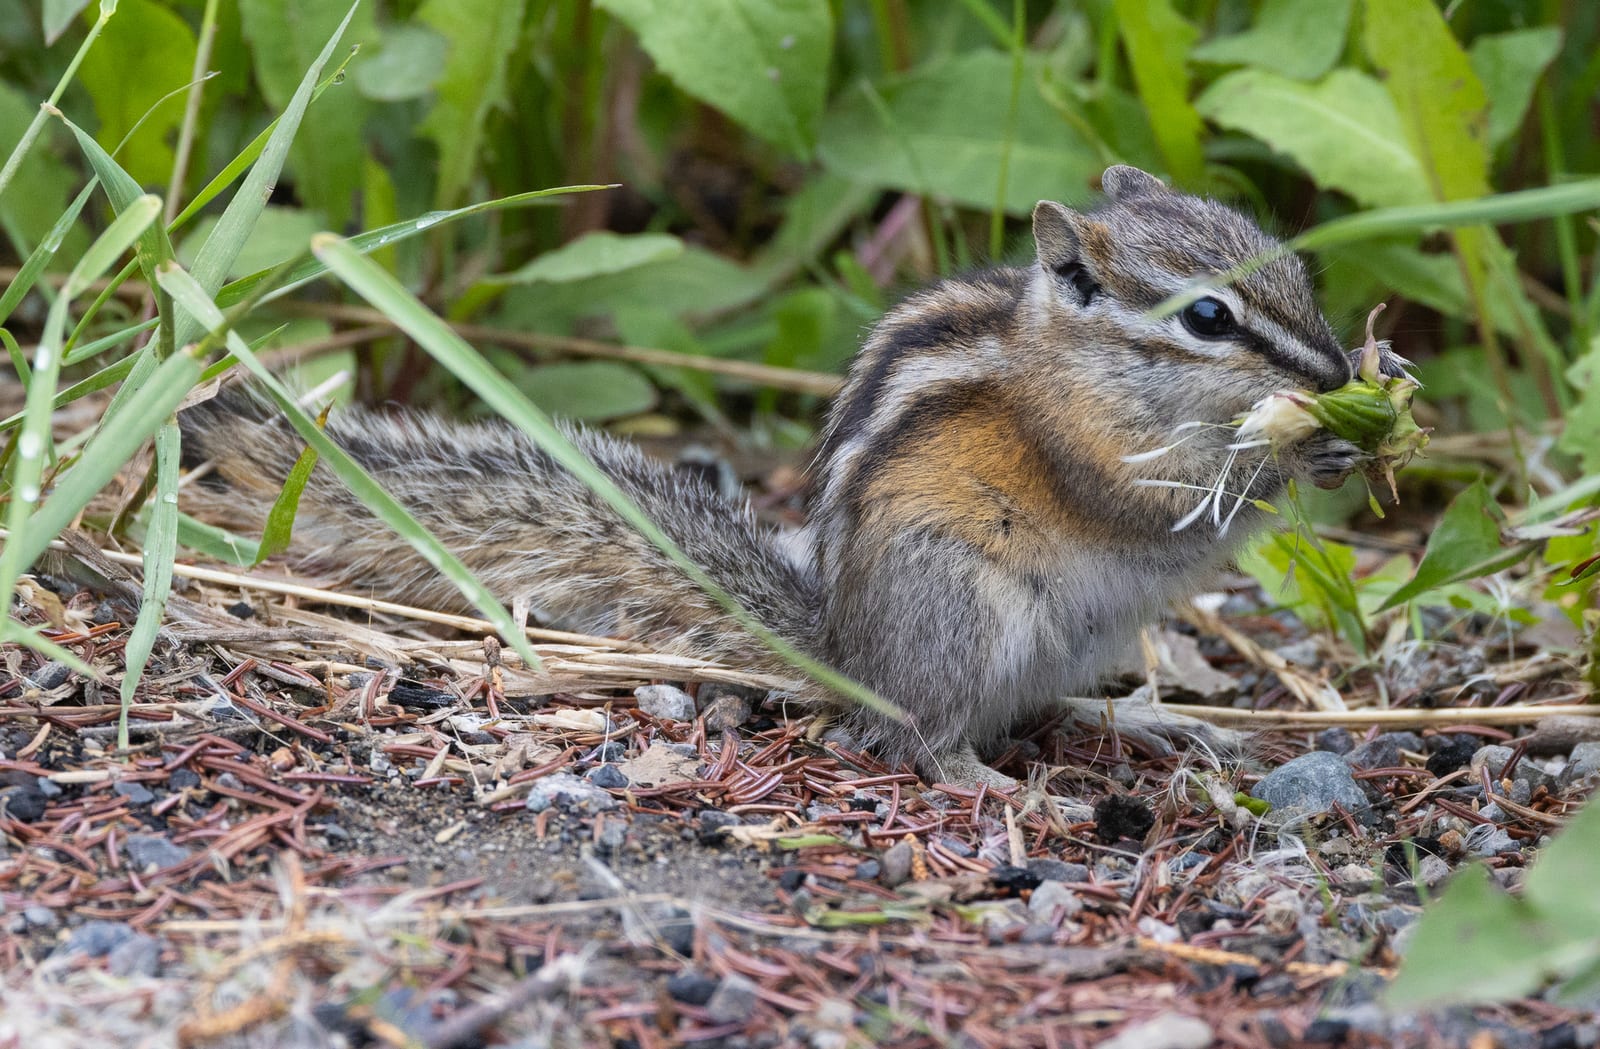
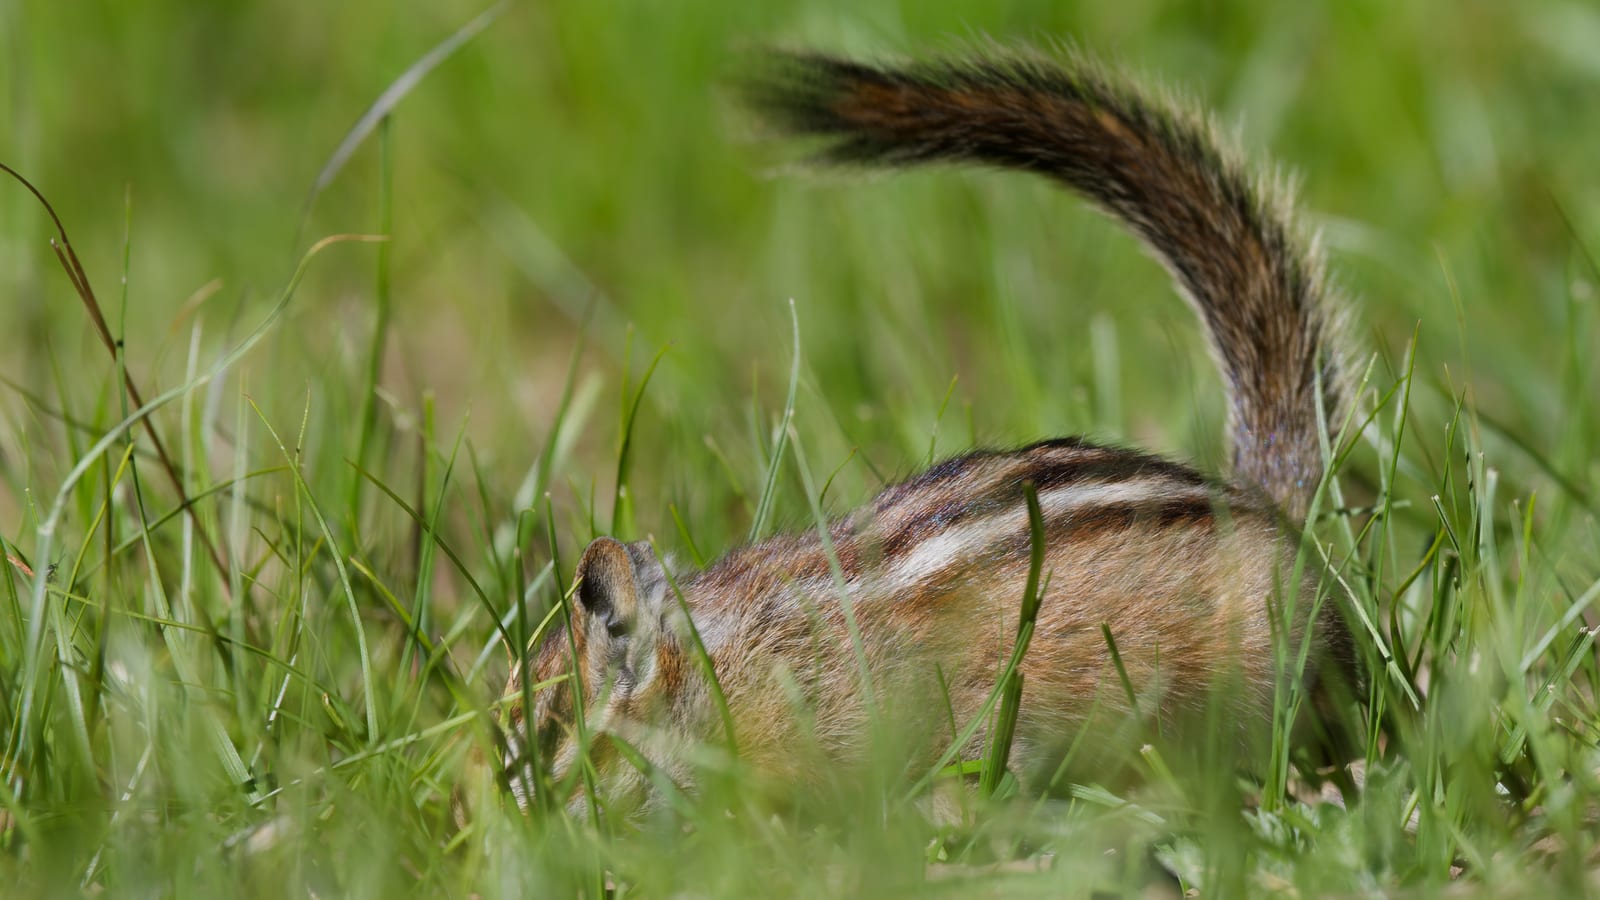
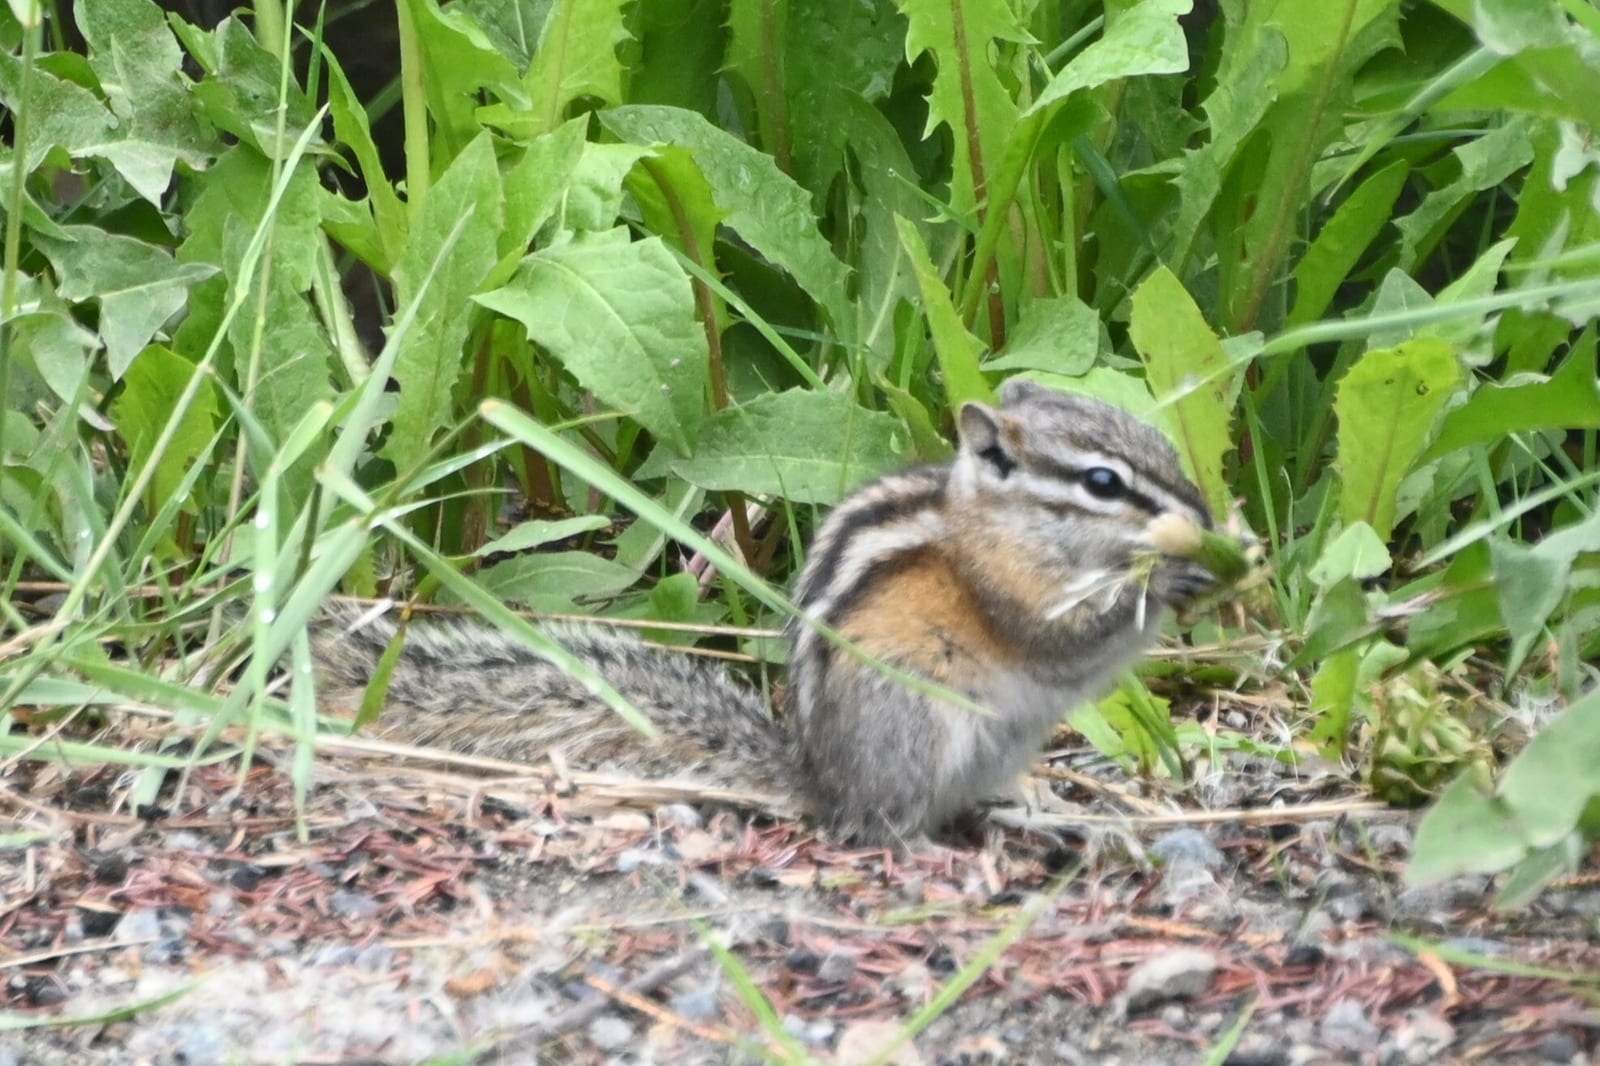
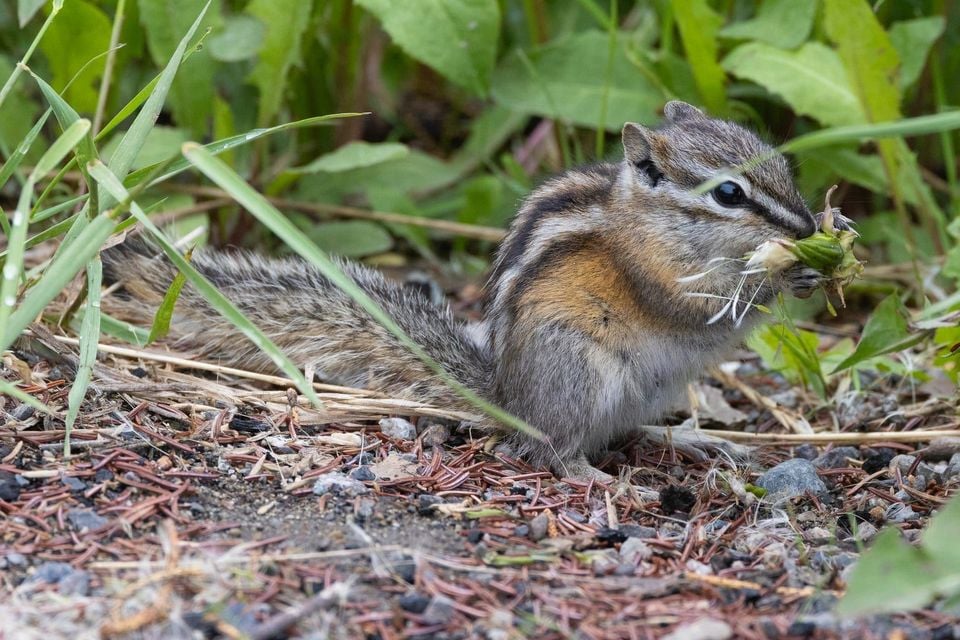
Least Chipmunk in Utah

Neotamias minimus

Native to Utah S5 Secure in Utah

Not listed as nonindigenous in Utah by USGS NAS; native to its Utah range.

IUCN Red List status

  1. LC
  2. NT
  3. VU
  4. EN
  5. CR
  6. EW
  7. EX

LC – Least Concern

Widespread and abundant; not at risk.

Least Chipmunk in Utah, by the numbers

Common in Utah 33rd most recorded of 141 mammals logged in Utah

465 occurrence records
351 with iNaturalist photos

Records from 2000–2026.

465 total records count every Utah occurrence from GBIF and iNaturalist; the map plots a georeferenced sample of 300; the monthly chart covers the 452 records with a full observation date.

When to look for the Least Chipmunk in Utah

Most sightings fall in June to September.

452 Utah occurrence records (iNaturalist and GBIF) by month of year, 2000–2026. Shows when the species is recorded, not a guarantee of presence.

Monthly Utah records (table)
MonthRecords
January0
February0
March2
April18
May56
June64
July101
August74
September103
October26
November7
December1

Monthly least chipmunk occurrence records (iNaturalist and GBIF) in Utah, 2000–2026.

Seasonality

Year-round in Utah, with recorded sightings peaking in June–September.

Occurrence map

Where Least Chipmunk has been recorded in Utah

300 records mapped · zoom and drag to explore

300 Utah records mapped

Notable places to look

Park, forest, or monumentiNaturalist records
Bryce Canyon National Park 39
Wasatch National Forest 9
Zion National Park 8
Cache National Forest 7
Jordanelle State Park 5
Cedar Breaks National Monument 4
Deer Creek State Park 4
Manti-La Sal National Forest 3

Protected places with the most least chipmunk sightings, from the USGS Protected Areas Database plus named mountain ranges, good spots to look, not a full breakdown, so they don't sum to the total.

Where it's recorded in Utah

CountyRecords
Salt Lake County 121
Garfield County 56
Summit County 46
Tooele County 41
Wasatch County 38
San Juan County 32
Utah County 17
Cache County 13
Washington County 9
Emery County 9
Iron County 8
Uintah County 8
13 other counties 67

The complete county distribution, spread across 25 Utah counties. Every occurrence record falls in one county, so these sum to the total. Counties from GBIF and US Census boundaries.

Least chipmunk reports in Utah lead with Bryce Canyon National Park and run through the Wasatch and Cache national forests, Zion, and Cedar Breaks, while Salt Lake County, with 121, holds more than any other county. The species favors sagebrush, brushy woodland edges, and open conifer forest, from the rim country at Bryce up into the Wasatch.

Records climb sharply into summer and hold into early fall, with 101 of the state’s 465 in July and 103 in September, against 56 in May. iNaturalist supplies 351 of them, so casual photos of this day-active chipmunk, not just small-mammal surveys, drive much of the count.

NatureServe lists the least chipmunk as S5, Secure, in Utah, the most stable rank on the scale and consistent with its wide range across the Mountain West.
Occurrence data from iNaturalist and GBIF.

More mammals in Utah in the atlas

Data & sources

The data and visualizations on this page draw on these open sources:

  • GBIFCC-BY 4.0occurrence records behind the range map, elevation, and record counts
  • iNaturalistCC0 / CC-BY / CC-BY-SAobservations, photos, and audio recordings
  • NatureServe ExplorerCC-BYthe state conservation rank
  • IUCN Red Listattributed factthe global conservation status
  • USGS NASpublic domainnative / introduced status
  • Natural Earthpublic domainthe relief basemap
  • USFSpublic domainnational-forest boundaries
  • USGS Protected Areas Databasepublic domainthe named parks, forests, and refuges behind "notable places to look"