California mammals

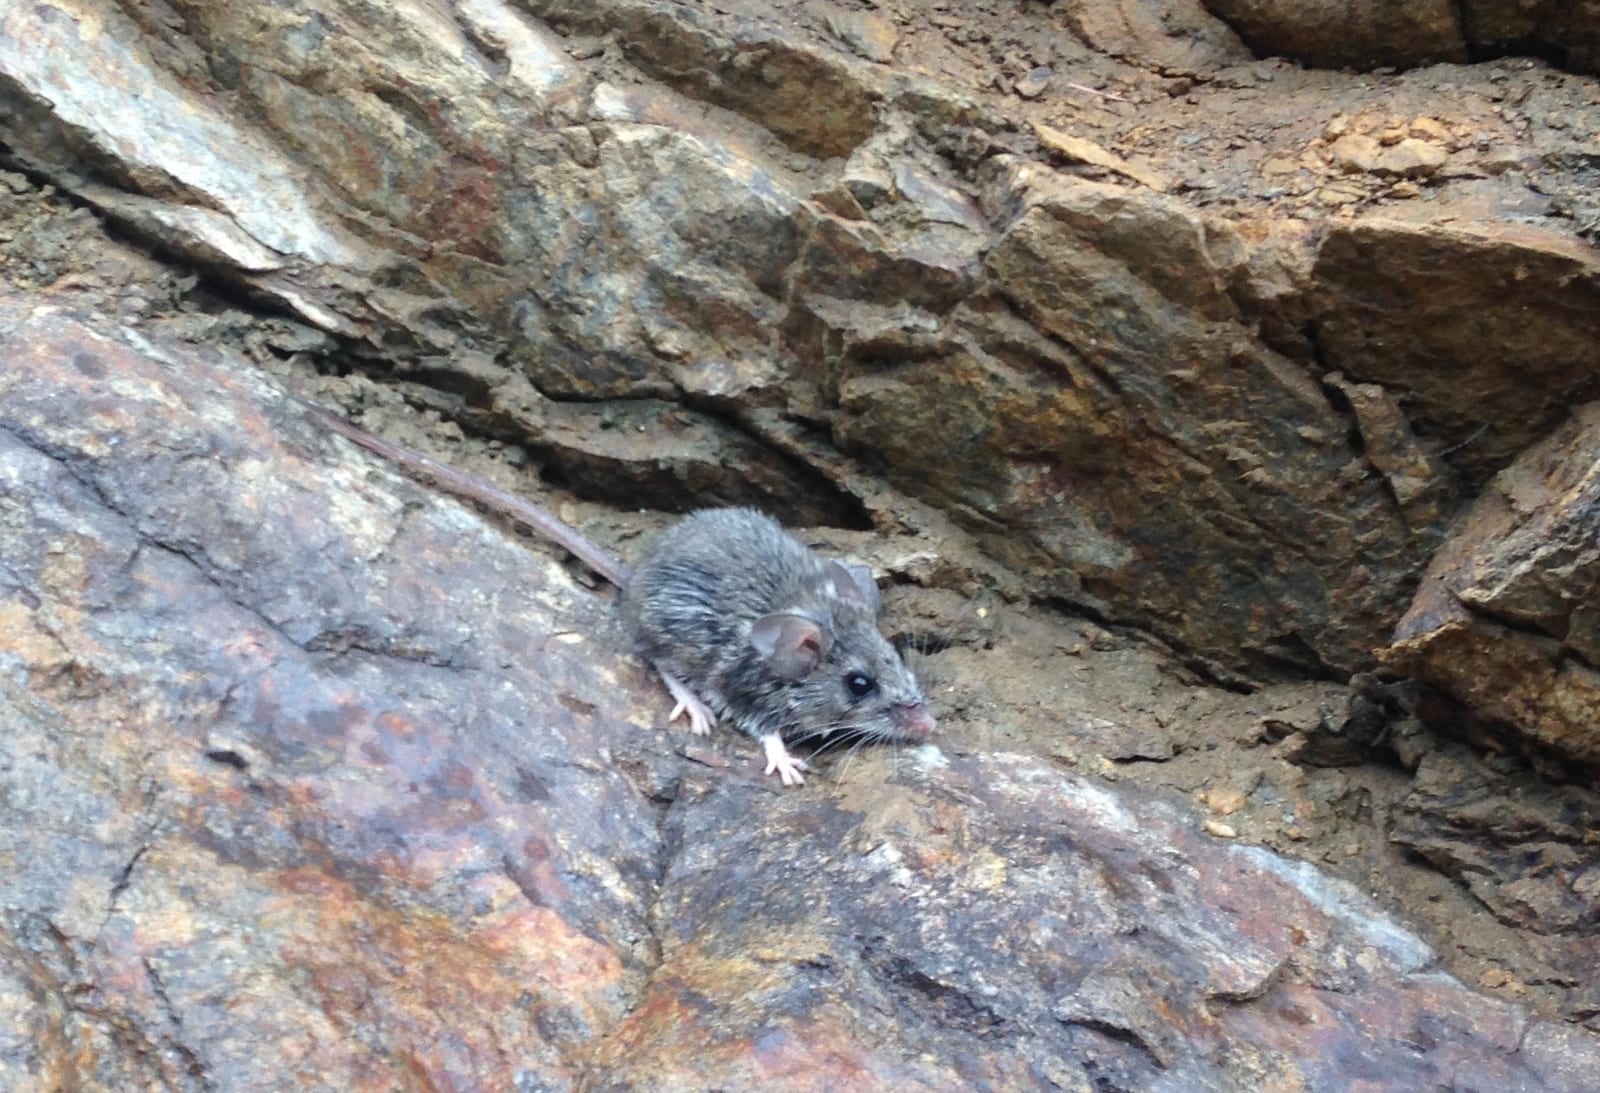
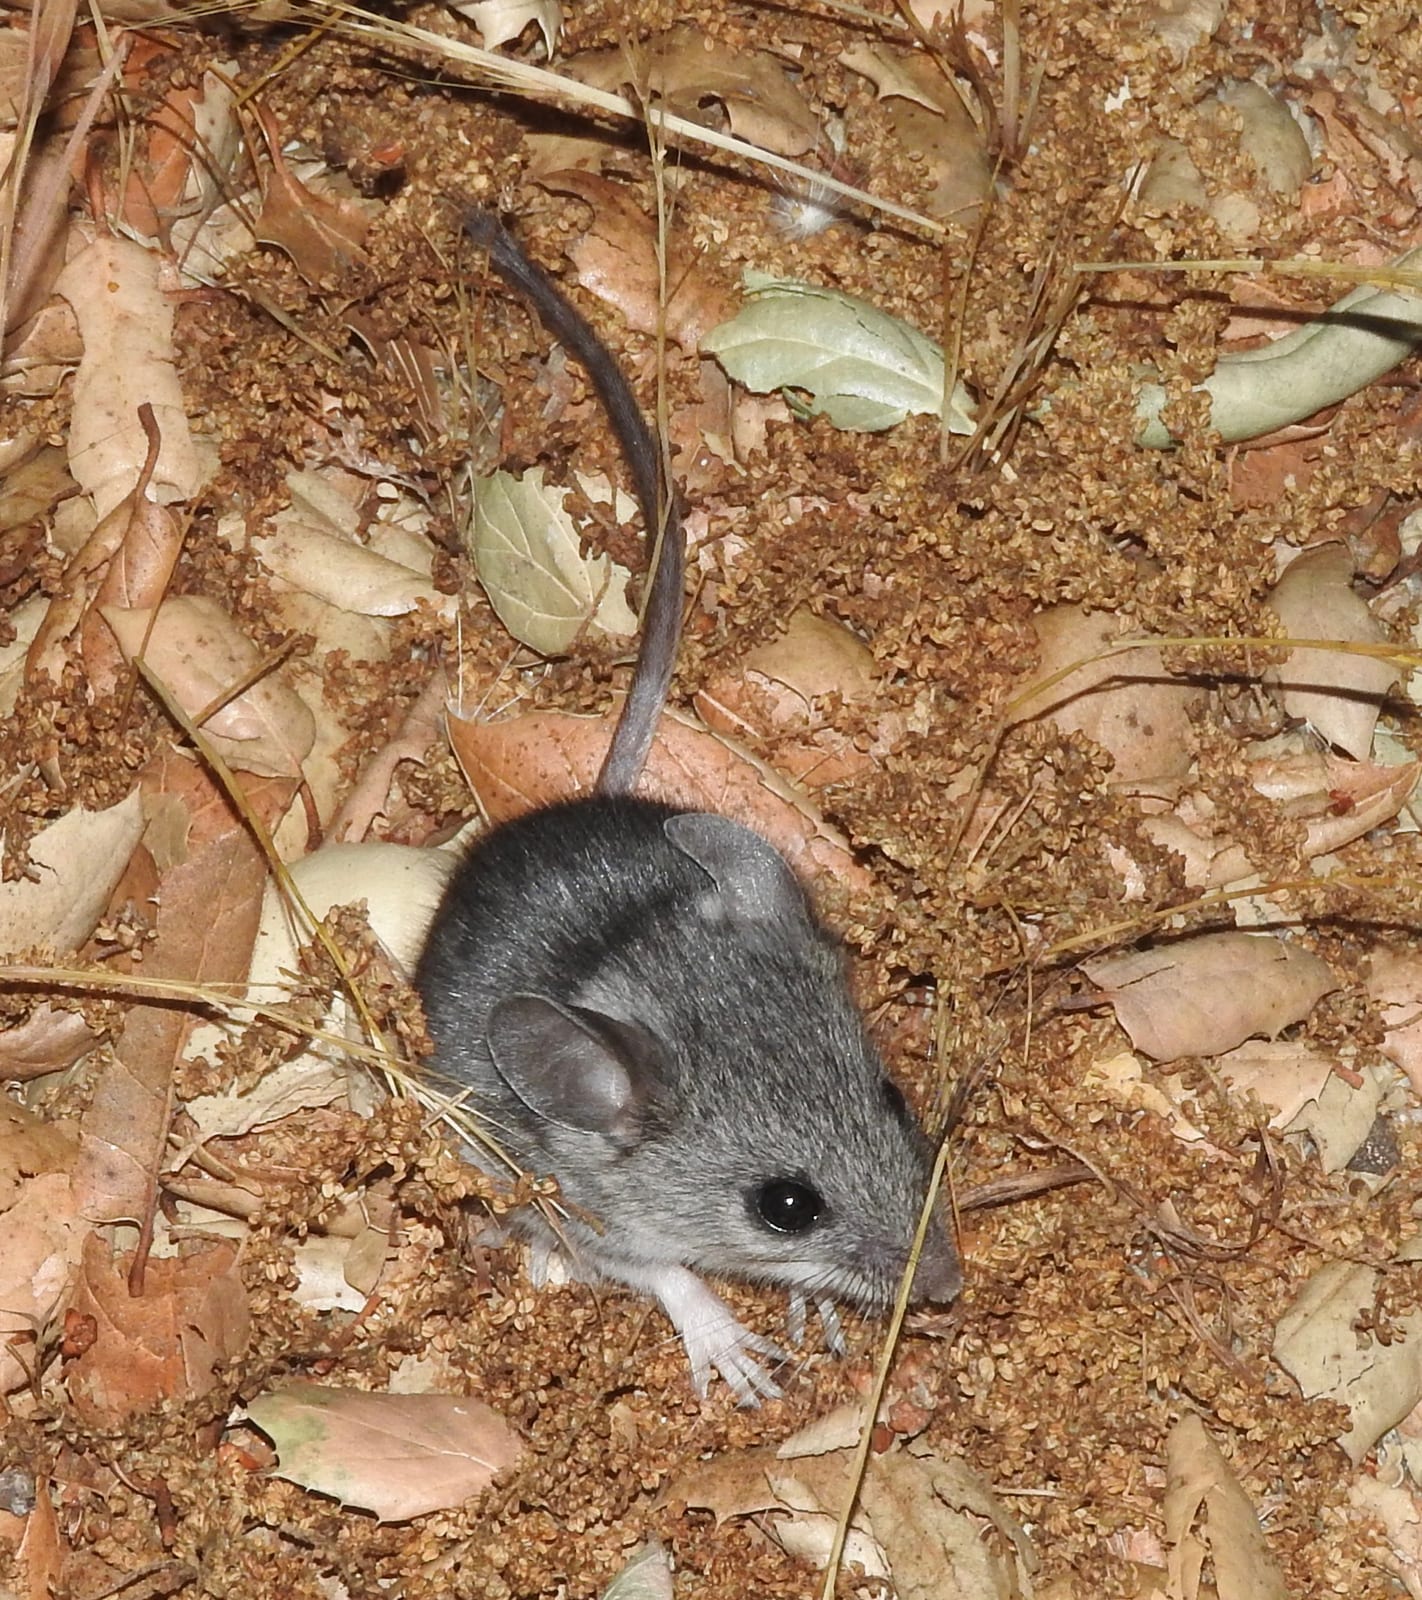
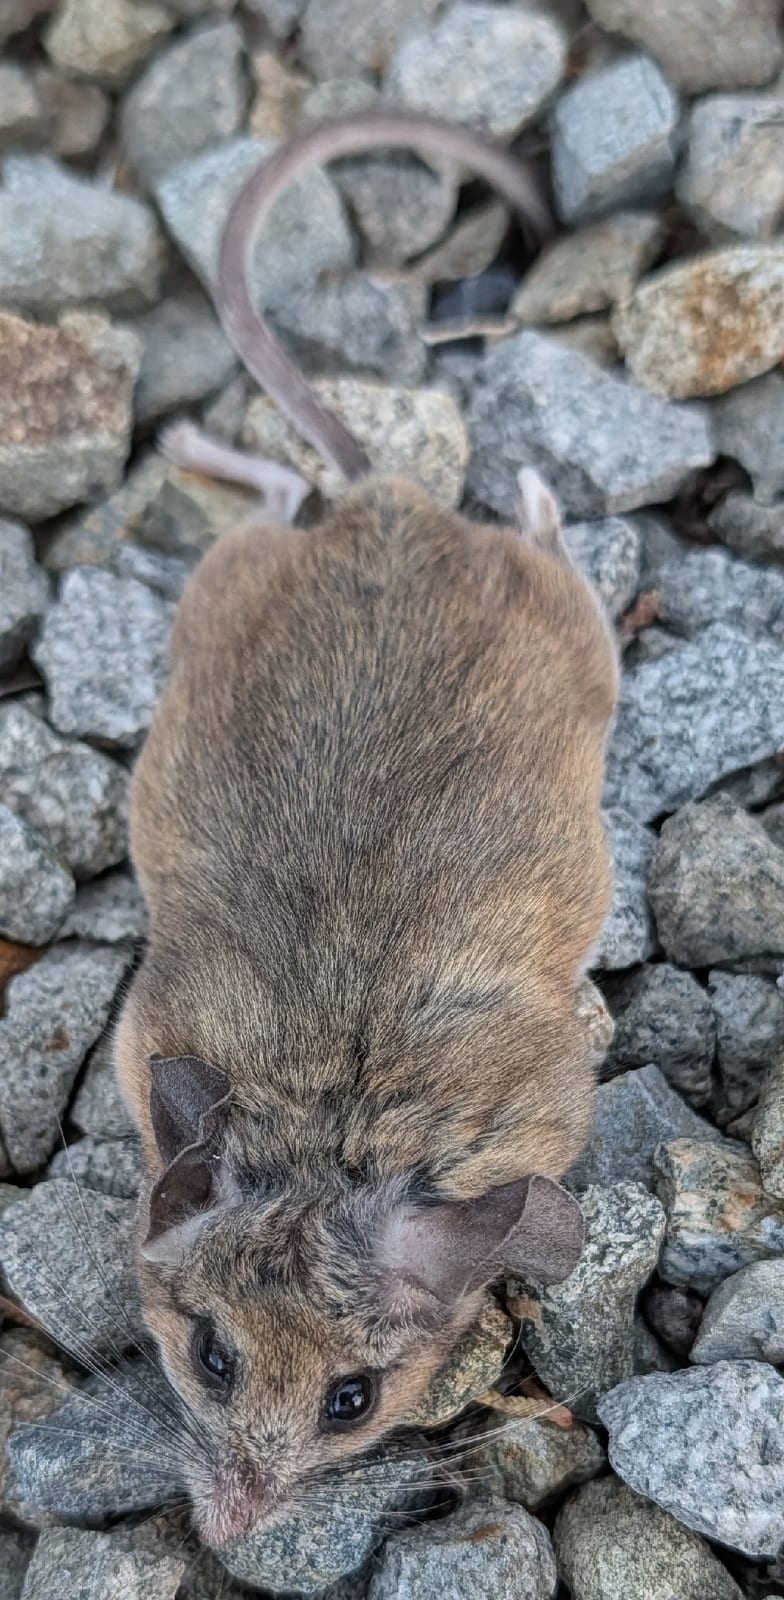
Brush Mouse in California

Peromyscus boylii

Native to California SNR Unranked in California

Not listed as nonindigenous in California by USGS NAS; native to its California range.

IUCN Red List status

  1. LC
  2. NT
  3. VU
  4. EN
  5. CR
  6. EW
  7. EX

LC – Least Concern

Widespread and abundant; not at risk.

Brush Mouse in California, by the numbers

Common in California 34th most recorded of 233 mammals logged in California

3,494 occurrence records
34 with iNaturalist photos

Records from 2000–2026.

3,494 total records count every California occurrence from GBIF and iNaturalist; the map plots a georeferenced sample of 300; the monthly chart covers the 3,488 records with a full observation date.

When to look for the Brush Mouse in California

Most sightings fall in March to June.

3,488 California occurrence records (iNaturalist and GBIF) by month of year, 2000–2026. Shows when the species is recorded, not a guarantee of presence.

Monthly California records (table)
MonthRecords
January316
February153
March304
April384
May435
June293
July234
August261
September394
October282
November368
December64

Monthly brush mouse occurrence records (iNaturalist and GBIF) in California, 2000–2026.

Seasonality

Year-round in California, with recorded sightings peaking in March–June, with a smaller rise in August–November and January.

Occurrence map

Where Brush Mouse has been recorded in California

300 records mapped · zoom and drag to explore

300 California records mapped

Notable places to look

Park, forest, or monumentiNaturalist records
San Joaquin Experimental Area 1,268
Yosemite National Park 187
Hastings Natural History Reserve 54
Kings Canyon National Park 25
Giant Sequoia National Monument 20
John Muir Wilderness 12
Sequoia National Park 7
Canebrake Ecological Reserve 6

Protected places with the most brush mouse sightings, from the USGS Protected Areas Database plus named mountain ranges, good spots to look, not a full breakdown, so they don't sum to the total.

Where it's recorded in California

CountyRecords
Madera County 1,431
Fresno County 1,246
Mariposa County 249
Kern County 72
Inyo County 71
Monterey County 69
Riverside County 53
Placer County 36
Tulare County 34
El Dorado County 29
Tehama County 26
San Diego County 23
24 other counties 155

The complete county distribution, spread across 36 California counties. Every occurrence record falls in one county, so these sum to the total. Counties from GBIF and US Census boundaries.

Brush mouse records follow California’s rocky chaparral and oak woodland. Reports gather in the western Sierra Nevada foothills of Madera and Fresno counties, where the San Joaquin Experimental Area alone holds 1,268 records, with smaller numbers from Yosemite National Park and the southern Coast Ranges.

Most records come from museum and survey work rather than casual community sightings. Reports run high from March through May, peaking in May, with a second rise in September and November and a sharp drop in December. Trapping schedules and field access can shape that peak, so it shouldn’t be read as a count of mice.
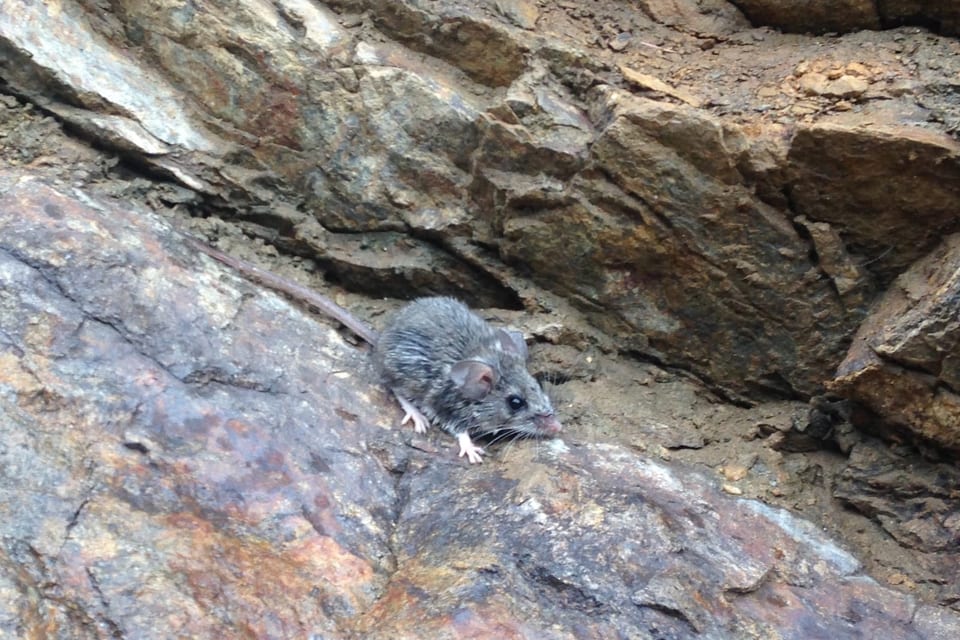
Occurrence data from iNaturalist and GBIF.

More mammals in California in the atlas

Data & sources

The data and visualizations on this page draw on these open sources:

  • GBIFCC-BY 4.0occurrence records behind the range map, elevation, and record counts
  • iNaturalistCC0 / CC-BY / CC-BY-SAobservations, photos, and audio recordings
  • NatureServe ExplorerCC-BYthe state conservation rank
  • IUCN Red Listattributed factthe global conservation status
  • USGS NASpublic domainnative / introduced status
  • Natural Earthpublic domainthe relief basemap
  • USFSpublic domainnational-forest boundaries
  • USGS Protected Areas Databasepublic domainthe named parks, forests, and refuges behind "notable places to look"