California mammals

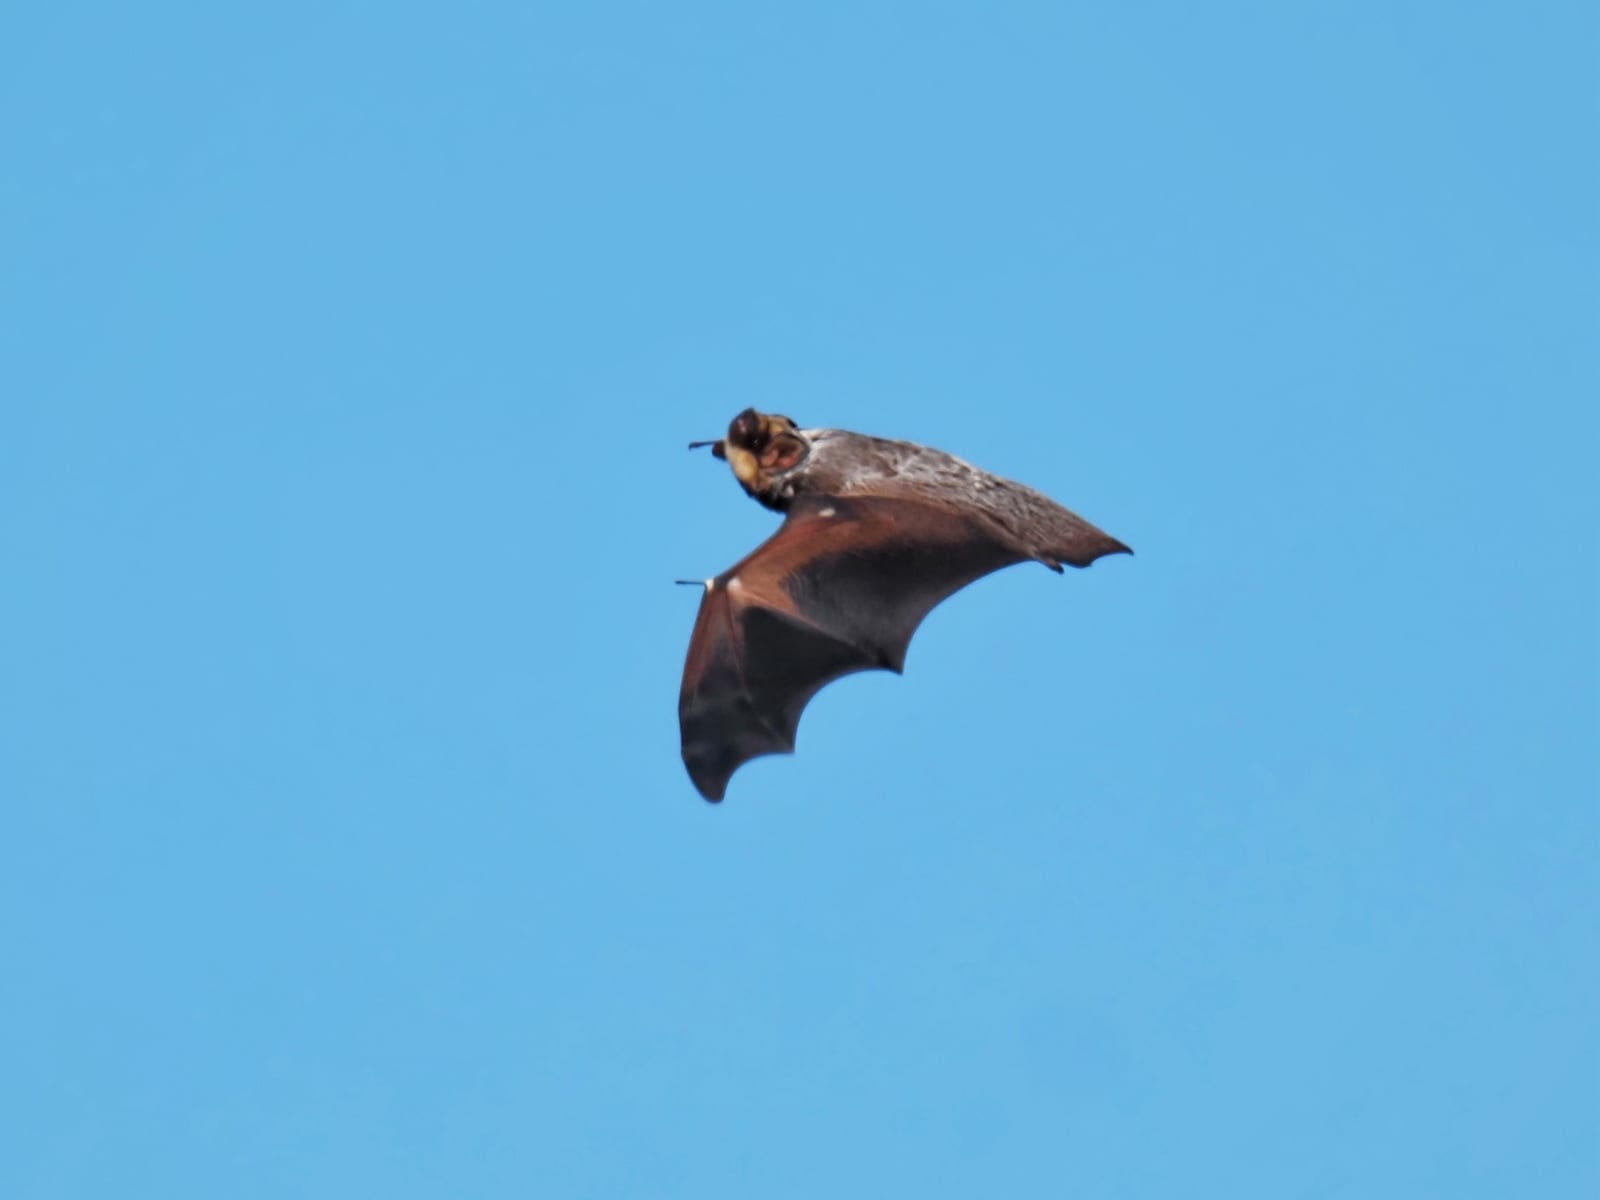
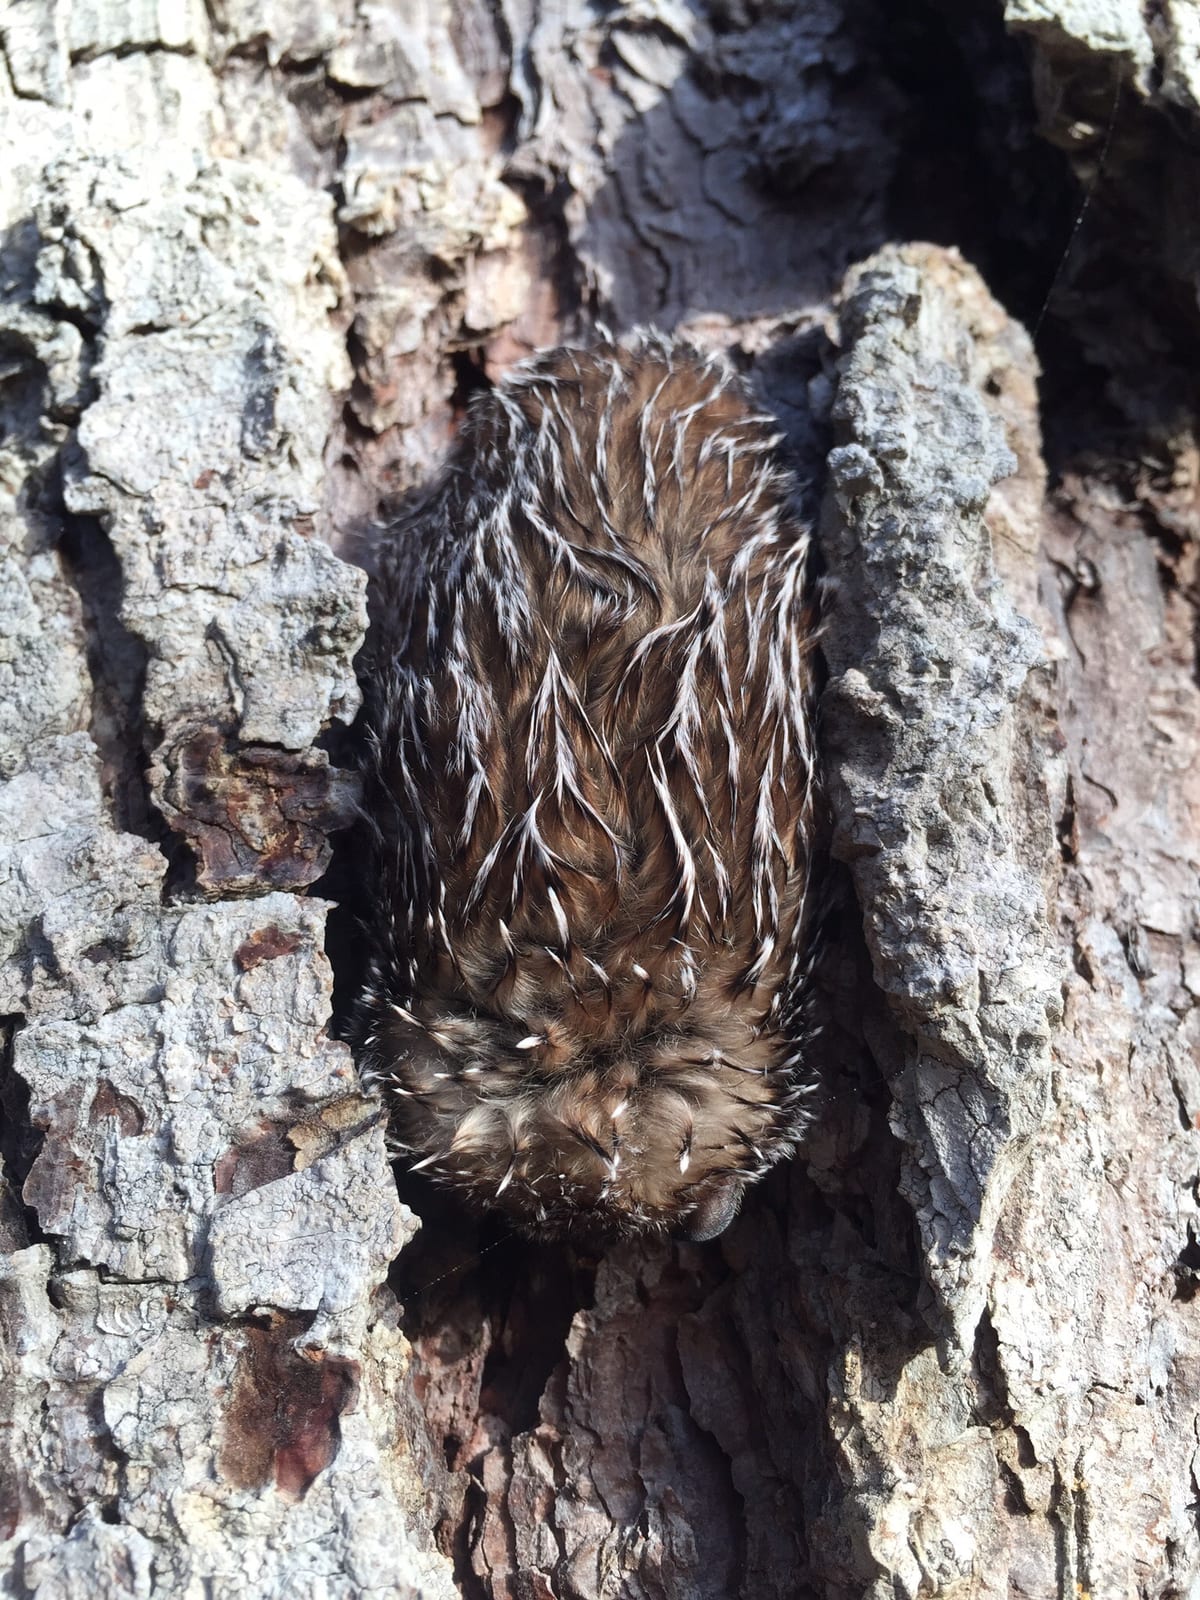
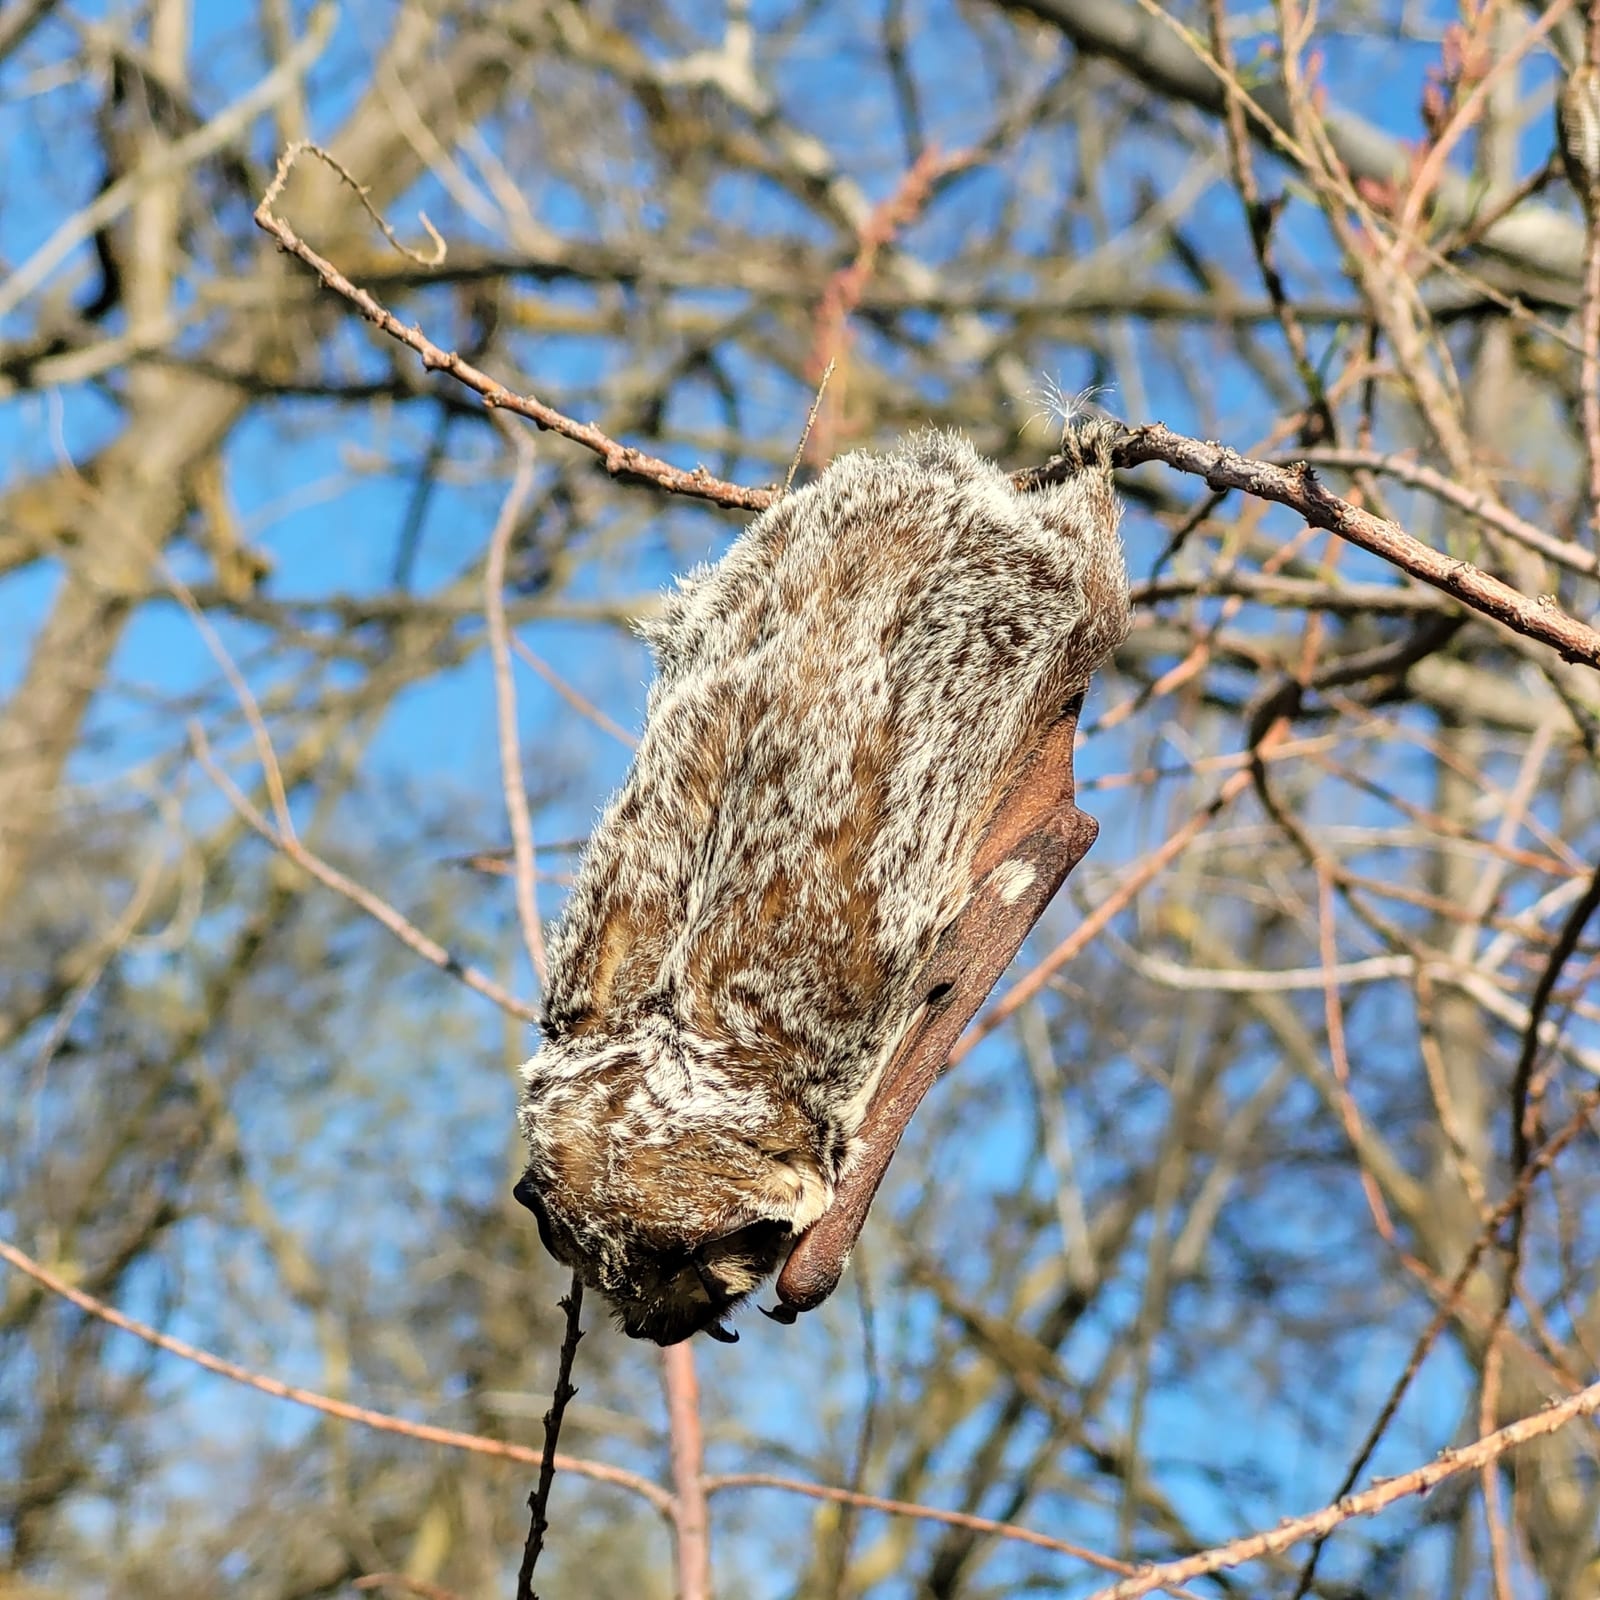
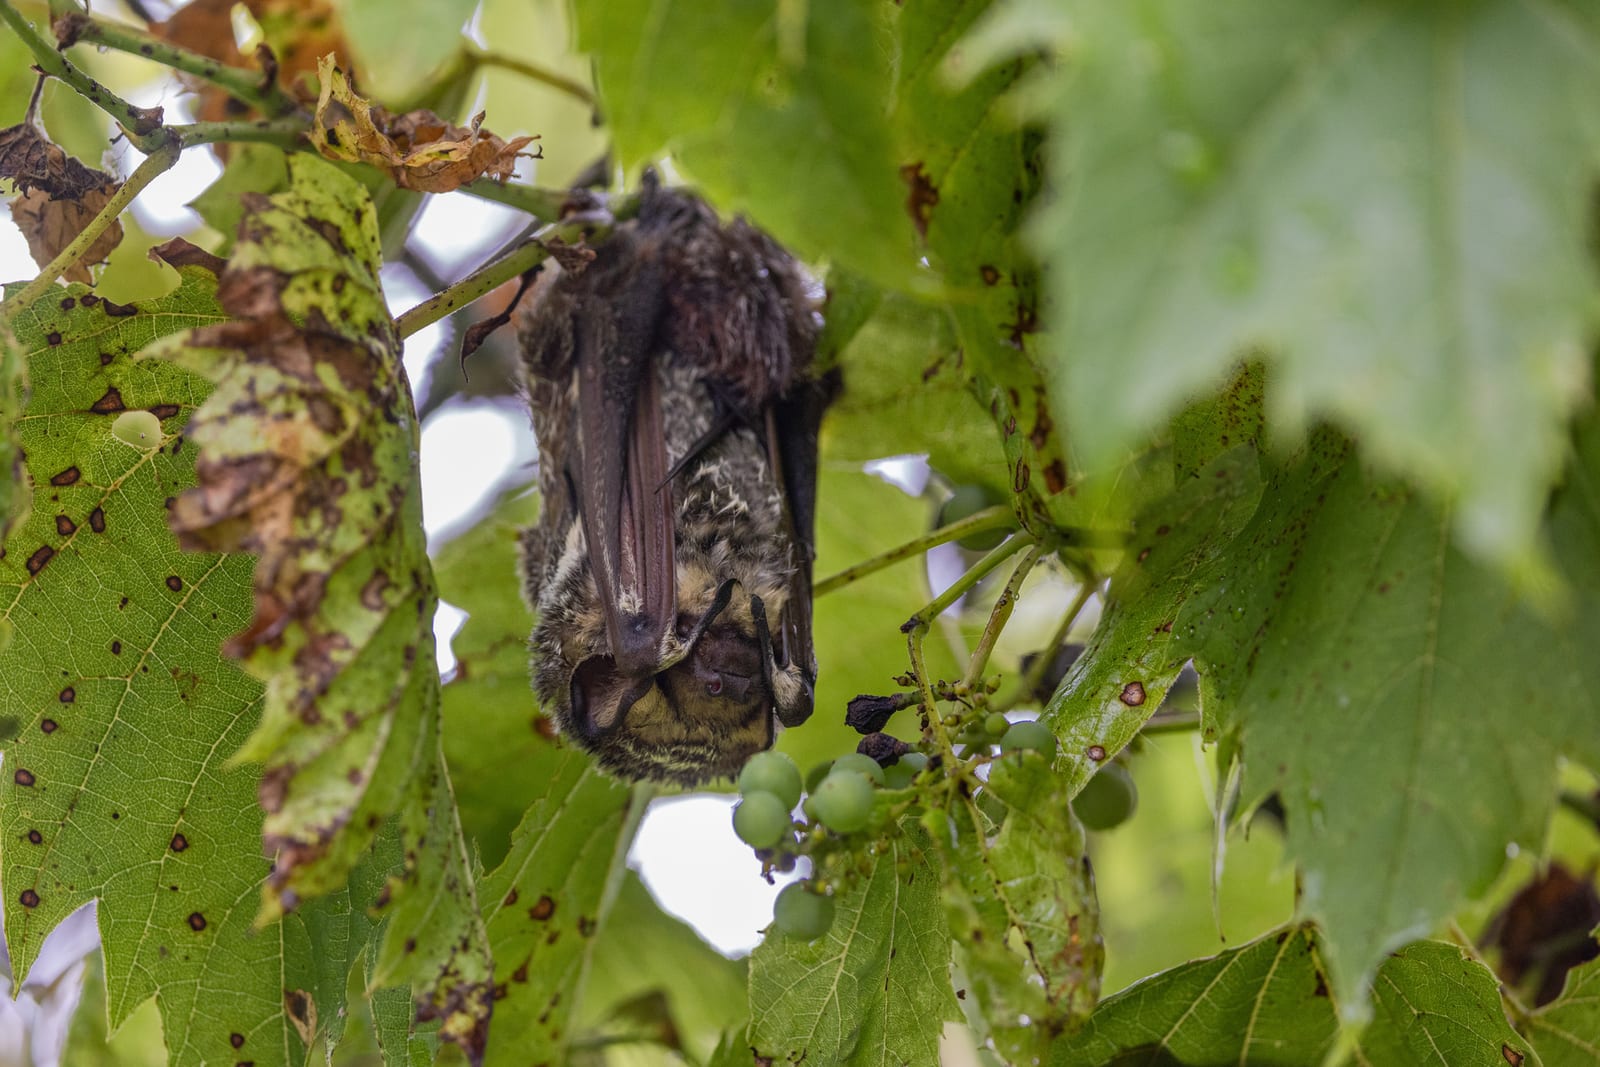
Northern Hoary Bat in California

Lasiurus cinereus

Native to California S4 Apparently Secure in California

Not listed as nonindigenous in California by USGS NAS; native to its California range.

IUCN Red List status

  1. LC
  2. NT
  3. VU
  4. EN
  5. CR
  6. EW
  7. EX

LC – Least Concern

Widespread and abundant; not at risk.

Northern Hoary Bat in California, by the numbers

Occasional in California 98th most recorded of 233 mammals logged in California

386 occurrence records
317 with iNaturalist photos

Records from 2000–2026.

386 total records count every California occurrence from GBIF and iNaturalist; the map plots a georeferenced sample of 300; the monthly chart covers the 373 records with a full observation date.

When to look for the Northern Hoary Bat in California

Most sightings fall in April.

373 California occurrence records (iNaturalist and GBIF) by month of year, 2000–2026. Shows when the species is recorded, not a guarantee of presence.

Monthly California records (table)
MonthRecords
January37
February29
March36
April64
May37
June8
July9
August13
September42
October39
November33
December26

Monthly northern hoary bat occurrence records (iNaturalist and GBIF) in California, 2000–2026.

Seasonality

Year-round in California, with recorded sightings peaking in April, with a smaller rise in September–October.

Occurrence map

Where Northern Hoary Bat has been recorded in California

300 records mapped · zoom and drag to explore

300 California records mapped

Notable places to look

Park, forest, or monumentiNaturalist records
Golden Gate National Recreation Area 12
Humboldt Redwoods State Park 5
Bidwell-Sacramento River State Park 5
Pinnacles National Park 3
Death Valley National Park 3
Santa Monica Mountains National Recreation Area 3
Angeles National Forest 3
Cascade Range 2

Protected places with the most northern hoary bat sightings, from the USGS Protected Areas Database plus named mountain ranges, good spots to look, not a full breakdown, so they don't sum to the total.

Where it's recorded in California

CountyRecords
San Diego County 53
Los Angeles County 49
San Francisco County 27
Humboldt County 26
Santa Clara County 25
Marin County 24
San Bernardino County 13
Sonoma County 12
Monterey County 11
Yolo County 10
Riverside County 9
Alameda County 9
30 other counties 118

The complete county distribution, spread across 42 California counties. Every occurrence record falls in one county, so these sum to the total. Counties from GBIF and US Census boundaries.

Northern Hoary Bat records connect California’s feeding grounds with places suitable for daytime shelter. The Sierra Nevada, Coast Ranges, desert oases, and developed valleys create sharply different combinations of insects, flowers, caves, trees, and buildings.

Reports tend to gather near roads, towns, parks, and monitored roosts, while high ridges and open desert receive less nighttime coverage. California’s dry summers make water especially important, but records near ponds don’t establish how many bats use the surrounding landscape.

The California record set contains 317 research-grade community observations. Monthly patterns can also reflect weather and observer activity, so they shouldn’t be treated as a direct count of animals.
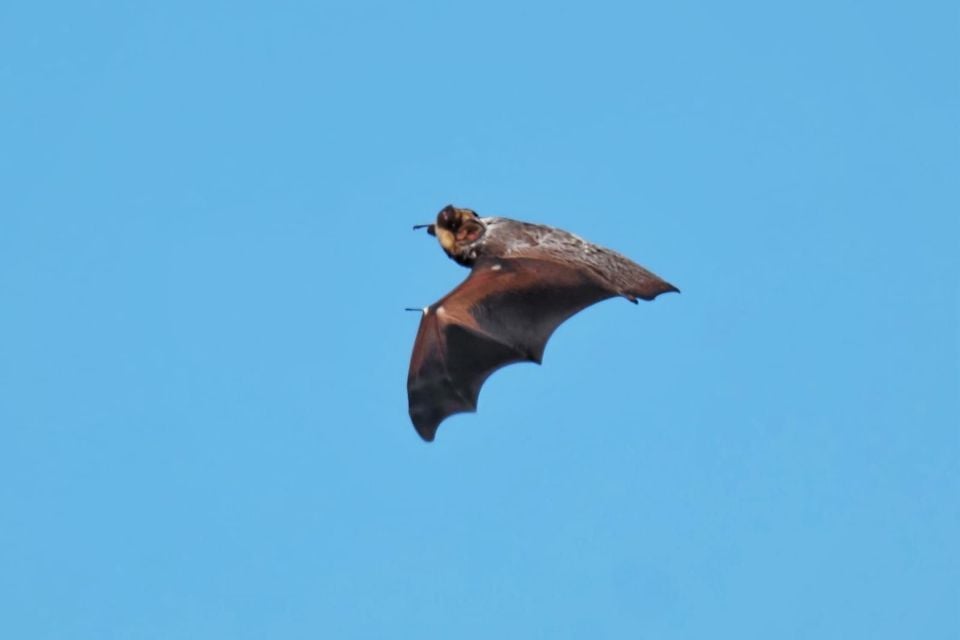
Occurrence data from iNaturalist and GBIF.

More mammals in California in the atlas

Data & sources

The data and visualizations on this page draw on these open sources:

  • GBIFCC-BY 4.0occurrence records behind the range map, elevation, and record counts
  • iNaturalistCC0 / CC-BY / CC-BY-SAobservations, photos, and audio recordings
  • NatureServe ExplorerCC-BYthe state conservation rank
  • IUCN Red Listattributed factthe global conservation status
  • USGS NASpublic domainnative / introduced status
  • Natural Earthpublic domainthe relief basemap
  • USFSpublic domainnational-forest boundaries
  • USGS Protected Areas Databasepublic domainthe named parks, forests, and refuges behind "notable places to look"